How To Install Grafana 7 on CentOS 7
How To Install Grafana 7 on CentOS 7
In this blog post, we’ll cover the steps to Install Grafana 7 on CentOS 7. Grafana v7 was recently released in with plenty of new features and is available for installation. Grafana is an open source tool which allows you to query, visualize and do alerting on your metrics no matter the backend data store.

For Ubuntu server, check:
How to Install Grafana 7 on Ubuntu
What is new in Grafana 7.0?
Azure Monitor: Deep linking from Log Analytic queries to the Azure Portal
CloudWatch/Logs: Add data links to CloudWatch logs for deep linking to AWS.
CloudWatch: Unify look of query mode select between dashboard and explore.
Docker: Adds tzdata package to Ubuntu image
Editor: New line on Enter, run query on Shift+Enter.
Loki: Allow multiple derived fields with the same name
Orgs: Added future deprecation notice
Read more on Grafana 7 release page.
Step 1: Install Grafana 7 on CentOS 7
Grafana 6 is now available for installation. Add Grafana RPM repository to your system.
sudo tee  /etc/yum.repos.d/grafana.repo<<EOF
[grafana]
name=grafana
baseurl=https://packages.grafana.com/oss/rpm
repo_gpgcheck=1
enabled=1
gpgcheck=1
gpgkey=https://packages.grafana.com/gpg.key
sslverify=1
sslcacert=/etc/pki/tls/certs/ca-bundle.crt
EOF
If you’re interested in Beta releases of Grafana, then add beta repository.
[grafana]
name=grafana
baseurl=https://packages.grafana.com/oss/rpm-beta
repo_gpgcheck=1
enabled=1
gpgcheck=1
gpgkey=https://packages.grafana.com/gpg.key
sslverify=1
sslcacert=/etc/pki/tls/certs/ca-bundle.crt
Once the repository is added, install grafana rpm package.
sudo yum -y install grafana
See more details about installed package.
$ rpm -qi grafana
Name        : grafana
Version     : 7.2.0
Release     : 1
Architecture: x86_64
Install Date: Mon 05 Oct 2020 06:16:04 PM UTC
Group       : default
Size        : 171426337
License     : "Apache 2.0"
Signature   : RSA/SHA256, Wed 23 Sep 2020 12:20:27 PM UTC, Key ID 8c8c34c524098cb6
Source RPM  : grafana-7.2.0-1.src.rpm
Build Date  : Wed 23 Sep 2020 12:19:56 PM UTC
Build Host  : 2d74f39865d4
Relocations : /
Packager    : contact@grafana.com
Vendor      : Grafana
URL         : https://grafana.com
Summary     : Grafana
Step 2: Start Grafana 7 service on CentOS 7
After the installation of Grafana 7 on CentOS 7, the service can be started and enabled to start on system start using systemctl service management command:
sudo systemctl enable --now grafana-server
The service should be in running state.
$ systemctl status  grafana-server
  ● grafana-server.service - Grafana instance
    Loaded: loaded (/usr/lib/systemd/system/grafana-server.service; enabled; vendor preset: disabled)
    Active: active (running) since Tue 2019-06-04 11:19:36 UTC; 5min ago
      Docs: http://docs.grafana.org
  Main PID: 25423 (grafana-server)
    CGroup: /system.slice/grafana-server.service
            └─25423 /usr/sbin/grafana-server --config=/etc/grafana/grafana.ini --pidfile=/var/run/grafana/grafana-server.pid --packaging=rpm cfg:…
Step 3: Configure Firewall
If you have an active firewalld service, ensure port 3000 is allowed.
sudo firewall-cmd --add-port=3000/tcp --permanent
sudo firewall-cmd --reload
Confirm the port is allowed in the firewalld.
$
ports: 3000/tcp
Step 4: Access Grafana Dashboard
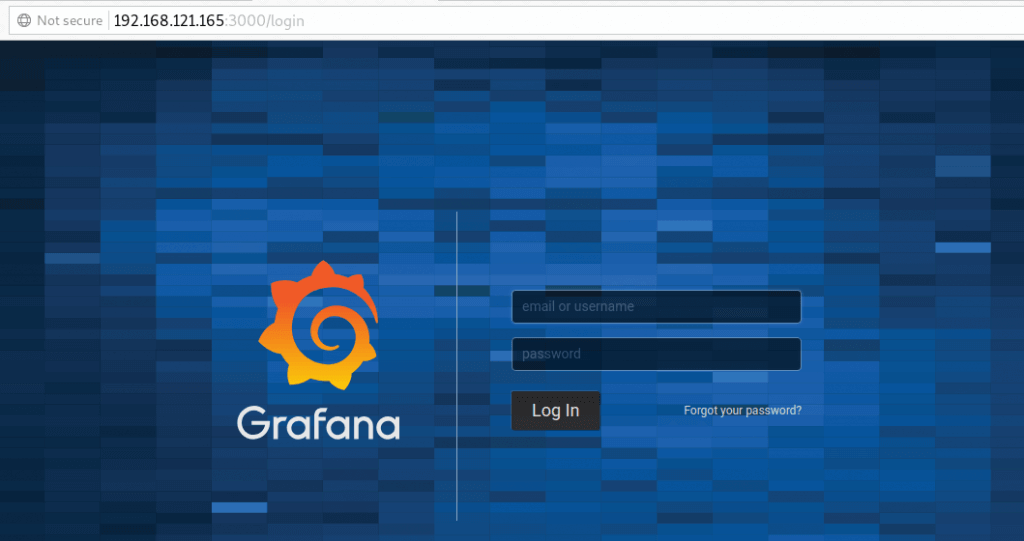
Once the service has been started, you can access its web dashboard by visiting http://[serverip|hostname]:3000.

The default login details are:
Username: admin
Password: admin
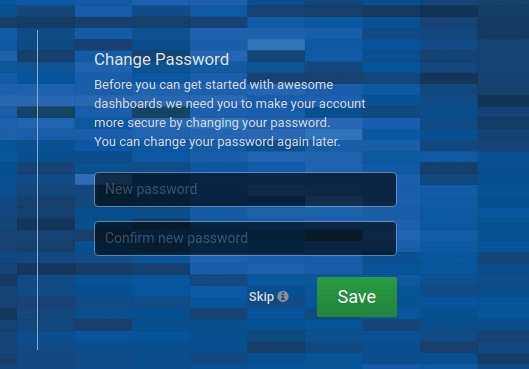
You’re asked to reset admin password after successful login. Provide a new password and confirm.

Grafana Package details:
Installs binary to
/usr/sbin/grafana-serverInstalls Init.d script to
/etc/init.d/grafana-serverCreates a default file (environment vars) to
/etc/sysconfig/grafana-serverInstalls configuration file to
/etc/grafana/grafana.iniInstalls systemd service (if systemd is available) name
grafana-server.serviceThe default configuration sets the log file at
/var/log/grafana/grafana.logThe default configuration specifies a sqlite3 db at
/var/lib/grafana/grafana.dbInstalls HTML/JS/CSS and other Grafana files at
/usr/share/grafana
Step 5: Adding Data Sources to Grafana
Grafana supports many different storage backends for your time series data. Each Data Source has a specific Query Editor that is customized for the features and capabilities that the particular Data Source exposes.
The following datasources are officially supported:
Step 6: Monitoring with Grafana
See our few guides on how you can monitor your infrastructure using Grafana and InfluxDB / Prometheus.
Monitor Linux System with Grafana and Telegraf
Monitoring Ceph Cluster with Prometheus and Grafana
How to Monitor BIND DNS server with Prometheus and Grafana
Monitoring MySQL / MariaDB with Prometheus in five
How to Monitor Apache Web Server with Prometheus and Grafana in 5 minutes
How to Monitor Linux Server Performance with Prometheus and Grafana in 5 minutes
How to Monitor Redis Server with Prometheus and Grafana in 5 minutes
How to Monitor Apache Web Server with Prometheus and Grafana in 5 minutes
目录 返回
首页