How To Install Grafana on CentOS 8 / RHEL 8
How To Install Grafana on CentOS 8 / RHEL 8
How can I install Grafana 7 on RHEL 8 / CentOS 8?. This guide will walk you through the installation of Grafana on RHEL / CentOS 8. Grafana is a free and open source feature-rich graph editor & metrics dashboard for various data sources such as Elasticsearch, Graphite, OpenTSDB, Prometheus, and InfluxDB.
We have other installation guides for Grafana, choose one for your Linux distribution.
How to Install Grafana on Ubuntu and Debian
Install Grafana and InfluxDB on CentOS 7
Install Grafana on RHEL 8 / CentOS 8
Grafana can be installed on RHEL / CentOS 8 from YUM repository or by manually downloading and installing .rpm package. The former is preferred method since it is easy to update and uninstall Grafana with the yum package manager.
Step 1: Add Grafana yum repository
Run the commands below as user with sudo privileges or as root user to add repository content.
cat <<EOF | sudo tee /etc/yum.repos.d/grafana.repo
[grafana]
name=grafana
baseurl=https://packages.grafana.com/oss/rpm
repo_gpgcheck=1
enabled=1
gpgcheck=1
gpgkey=https://packages.grafana.com/gpg.key
sslverify=1
sslcacert=/etc/pki/tls/certs/ca-bundle.crt
EOF
You can optionally update you cache index for available packages:
sudo dnf makecache
Step 2: Install Grafana on CentOS 8 / RHEL 8
When repository for Grafana has been configured, Grafana can be easily installed by running the commands below:
sudo dnf -y install grafana
Package info:
$ rpm -qi grafana
Name        : grafana
Version     : 7.2.0
Release     : 1
Architecture: x86_64
Install Date: Mon 05 Oct 2020 06:16:04 PM UTC
Group       : default
Size        : 171426337
License     : "Apache 2.0"
Signature   : RSA/SHA256, Wed 23 Sep 2020 12:20:27 PM UTC, Key ID 8c8c34c524098cb6
Source RPM  : grafana-7.2.0-1.src.rpm
Build Date  : Wed 23 Sep 2020 12:19:56 PM UTC
Build Host  : 2d74f39865d4
Relocations : /
Packager    : contact@grafana.com
Vendor      : Grafana
URL         : https://grafana.com
Summary     : Grafana
Step 3: Start Grafana Service
Grafana service is managed by systemd. Start the service and enable it to start on boot.
$
 Synchronizing state of grafana-server.service with SysV service script with /usr/lib/systemd/systemd-sysv-install.
 Executing: /usr/lib/systemd/systemd-sysv-install enable grafana-server
 Created symlink /etc/systemd/system/multi-user.target.wants/grafana-server.service → /usr/lib/systemd/system/grafana-server.service.
The default port used is 3000. If you have another process using this port, you’ll need to set custom port in Grafana configuration file /etc/grafana/grafana.ini.
http_port = 3000
Your grafana-server service should show running state.
$
 ● grafana-server.service - Grafana instance
    Loaded: loaded (/usr/lib/systemd/system/grafana-server.service; enabled; vendor preset: disabled)
    Active: active () since Thu 2019-01-10 23:18:24 EAT; 3min 12s ago
      Docs: http://docs.grafana.org
  Main PID: 2974 (grafana-server)
     Tasks: 9 (limit: 11510)
    Memory: 17.3M
    CGroup: /system.slice/grafana-server.service
            └─2974 /usr/sbin/grafana-server --config=/etc/grafana/grafana.ini --pidfile=/var/run/grafana/grafana-server.pid --packaging=rpm cfg:default>
 Jan 10 23:18:24 rhel8.local grafana-server[2974]: t=2019-01-10T23:18:24+0300 lvl=info msg="Initializing CleanUpService" logger=server
 Jan 10 23:18:24 rhel8.local grafana-server[2974]: t=2019-01-10T23:18:24+0300 lvl=info msg="Initializing NotificationService" logger=server
 Jan 10 23:18:24 rhel8.local grafana-server[2974]: t=2019-01-10T23:18:24+0300 lvl=info msg="Initializing ProvisioningService" logger=server
 Jan 10 23:18:24 rhel8.local grafana-server[2974]: t=2019-01-10T23:18:24+0300 lvl=info msg="Initializing PluginManager" logger=server
 Jan 10 23:18:24 rhel8.local grafana-server[2974]: t=2019-01-10T23:18:24+0300 lvl=info msg="Starting plugin search" logger=plugins
 Jan 10 23:18:24 rhel8.local grafana-server[2974]: t=2019-01-10T23:18:24+0300 lvl=info msg="Plugin dir created" logger=plugins dir=/var/lib/grafana/plu>
 Jan 10 23:18:24 rhel8.local grafana-server[2974]: t=2019-01-10T23:18:24+0300 lvl=info msg="Initializing TracingService" logger=server
 Jan 10 23:18:24 rhel8.local grafana-server[2974]: t=2019-01-10T23:18:24+0300 lvl=info msg="Initializing Stream Manager"
 Jan 10 23:18:24 rhel8.local grafana-server[2974]: t=2019-01-10T23:18:24+0300 lvl=info msg="HTTP Server Listen" logger=http.server address=0.0.0.0:3000>
 Jan 10 23:18:24 rhel8.local systemd[1]: Started Grafana instance.
By default, Grafana will write logs to /var/log/grafana directory and its SQLite database is located under /var/lib/grafana/grafana.db
Step 4: Open firewall port for Grafana
If you have a running firewalld service, allow port 3000for access to the dashboard from the network:
sudo firewall-cmd --add-port=3000/tcp --permanent
sudo firewall-cmd --reload
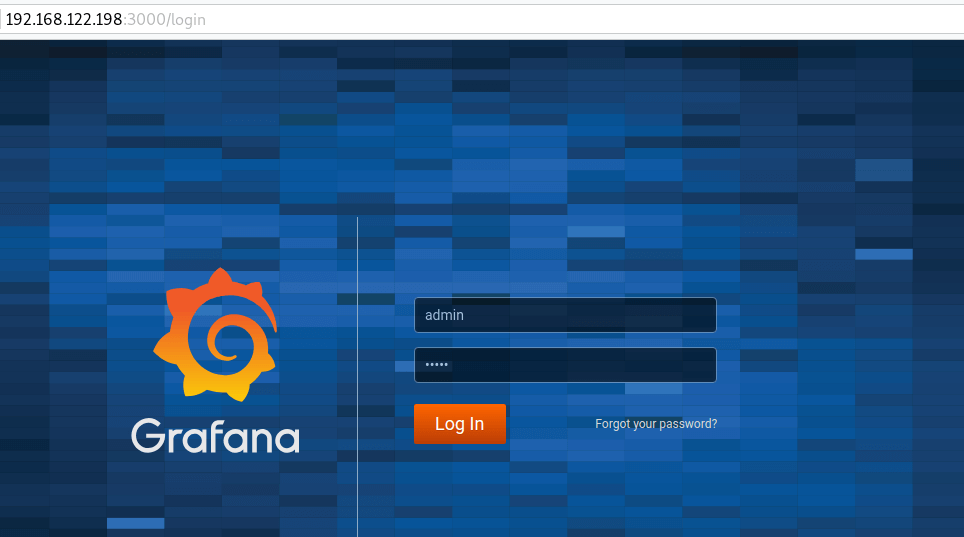
Step 5: Access Grafana Dashboard
Grafana web dashboard is accessible on http://[Server IP|Hostname]:3000

The default logins are:
username:
Password:
Change admin password in the next window.

Now that you have Grafana installed in your RHEL 8 server, you can check our monitoring guides:
Monitoring Ceph Cluster with Prometheus and Grafana
How to Monitor Linux Server Performance with Prometheus and Grafana in 5 minutes
How to Monitor BIND DNS server with Prometheus and Grafana
Monitoring MySQL / MariaDB with Prometheus in five minutes
How to Monitor Redis Server with Prometheus and Grafana in 5 minutes
How to Monitor Apache Web Server with Prometheus and Grafana in 5 minutes
目录 返回
首页