ELK logstash 过滤插件:JSON
Structure of a Config File
A Logstash config file has a separate section for each type of plugin you want to add to the event processing pipeline. For example:
# This is a comment. You should use comments to describe
# parts of your configuration.
input {
  ...
}

filter {
  ...
}

output {
  ...
}
Each section contains the configuration options for one or more plugins. If you specify multiple filters, they are applied in the order of their appearance in the configuration file.
The logstash agent is a processing pipeline with 3 stages: inputs → filters → outputs. Inputs generate events, filters modify them, outputs ship them elsewhere.
All events have properties. For example, an apache access log would have things like status code (200, 404), request path ("/", "index.html"), HTTP verb (GET, POST), client IP address, etc. Logstash calls these properties "fields."
Nginx 日志默认为普通文本的格式,例如,下面是 Nginx 的一行访问日志:
10.88.122.105 - - [02/Dec/2017:09:15:04 +0800] "GET /js/pagination.js HTTP/1.1" 304 0 "http://10.88.105.20:8063/stockrecommand.html" "Mozilla/4.0 (compatible; MSIE 7.0; Windows NT 6.1; WOW64; Trident/7.0; SLCC2; .NET CLR 2.0.50727; .NET CLR 3.5.30729; .NET CLR 3.0.30729; Media Center PC 6.0; .NET4.0C; .NET4.0E)" "-" 0.000为了便于利用 Elastic Stack 日志平台收集展示 Nginx 的日志,可以将 Nginx 的日志改成 json 的格式。修改后的 json 日志格式如下所示:
{ "@timestamp": "12/Dec/2017:14:30:40 +0800", "remote_addr": "10.88.122.108", "referer": "-", "request": "GET / HTTP/为了修改 Nginx 的日志格式改成 json,需要修改 Nginx 的配置文件
 log_format log_json '{ "@timestamp": "$time_local", '
'"remote_addr": "$remote_addr", '
'"referer": "$http_referer", '
'"request": "$request", '
'"status": $status, '
'"bytes": $body_bytes_sent, '
'"agent": "$http_user_agent", '
'"x_forwarded": "$http_x_forwarded_for", '
'"up_addr": "$upstream_addr",'
'"up_host": "$upstream_http_host",'
'"up_resp_time": "$upstream_response_time",'
'"request_time": "$request_time"'
' }';

access_log  /var/log/nginx/access.log  log_json;

[root@localhost ~]# nginx
[root@localhost ~]# nginx -s reload
在 Nginx 的配置文件nginx.conf中,我们定义了两种的日志格式:main和log_json,其中,main为普通的文本格式,log_json为 json 格式。log_json其实就是手工构造一个 json 字符串。定义了 json 的日志格式后,便可以指定 access log 为 json 格式,下面就是访问后产生的日志格式
{ "@timestamp": "16/Dec/2020:11:28:14 +0800", "remote_addr": "192.168.179.4", "referer": "-", "request": "GET / HTTP/1.1", "status": 304, "bytes": 0, "agent": "Mozilla/5.0 (Windows NT 10.0; Win64; x64) AppleWebKit/537.36 (KHTML, like Gecko) Chrome/84.0.4147.105 Safari/537.36", "x_forwarded": "-", "up_addr": "-","up_host": "-","up_resp_time": "-","request_time": "0.000" }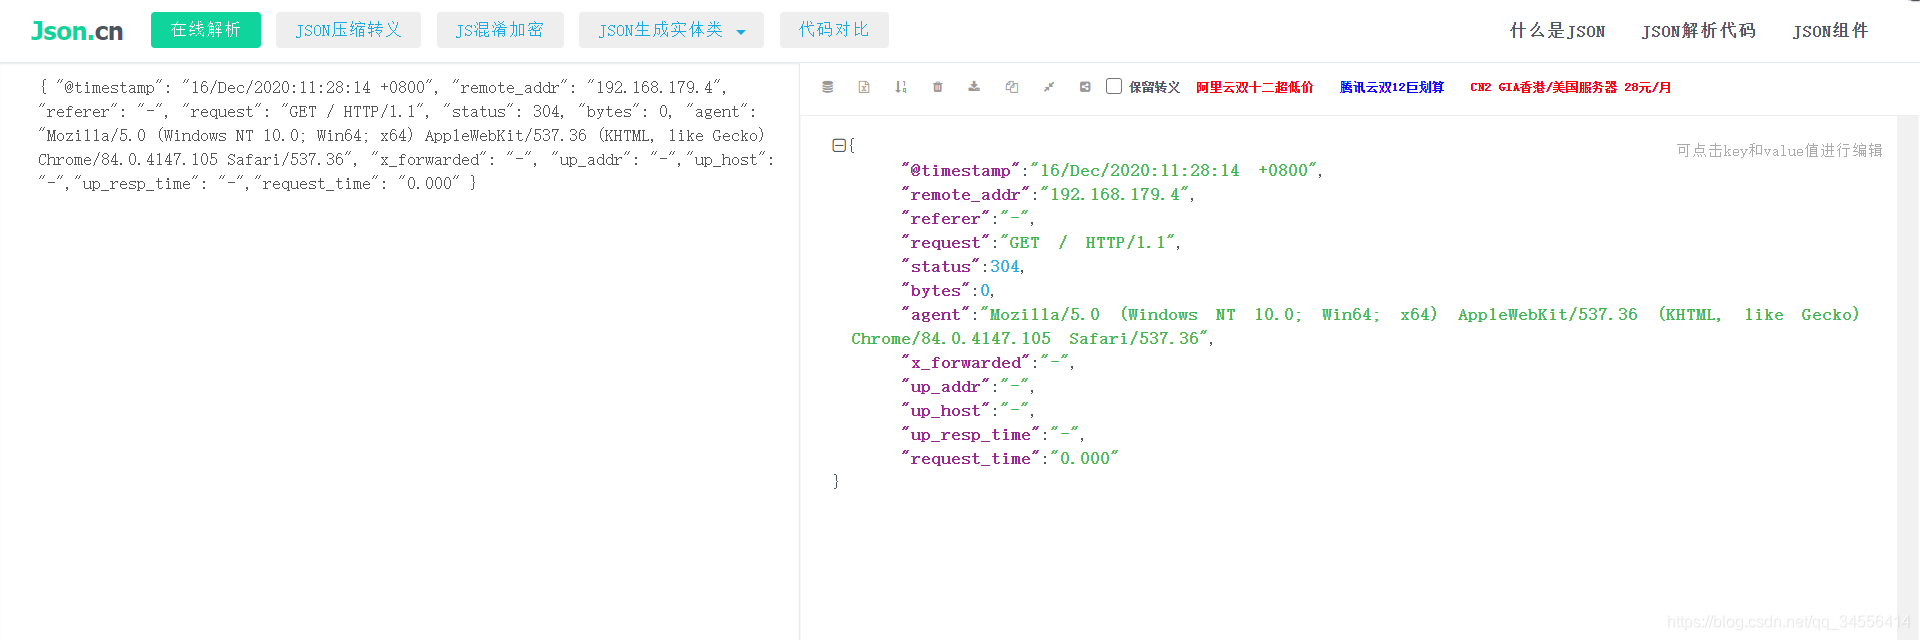
日志符合json格式,都可以被成功的解析,并且将一级字段解析为顶层字段
过滤插件:通用配置字段
过滤插件:JSON
- source 指定要解析的字段,一般是原始消息message字段
- target 将解析的结果放到指定字段,如果不指定,默认在 事件的顶层
[root@localhost ~]# cat /usr/local/logstash/conf.d/test.conf
input {
  file {
    path => "/var/log/nginx/*.log"
    exclude => "error.log"
    start_position => "beginning"
    tags => "web"
    tags => "nginx"
    type => "access"
    add_field => {
    "project" => "microservice"
    "app" => "product"
    }
  }
}

filter {
 json {
 source => "message"
 }
}

output {
  elasticsearch {
    hosts =>
    ["192.168.179.102:9200"]
    index => "test-%{+YYYY.MM.dd}"
 }
}
下面创建索引模式发现里面数据
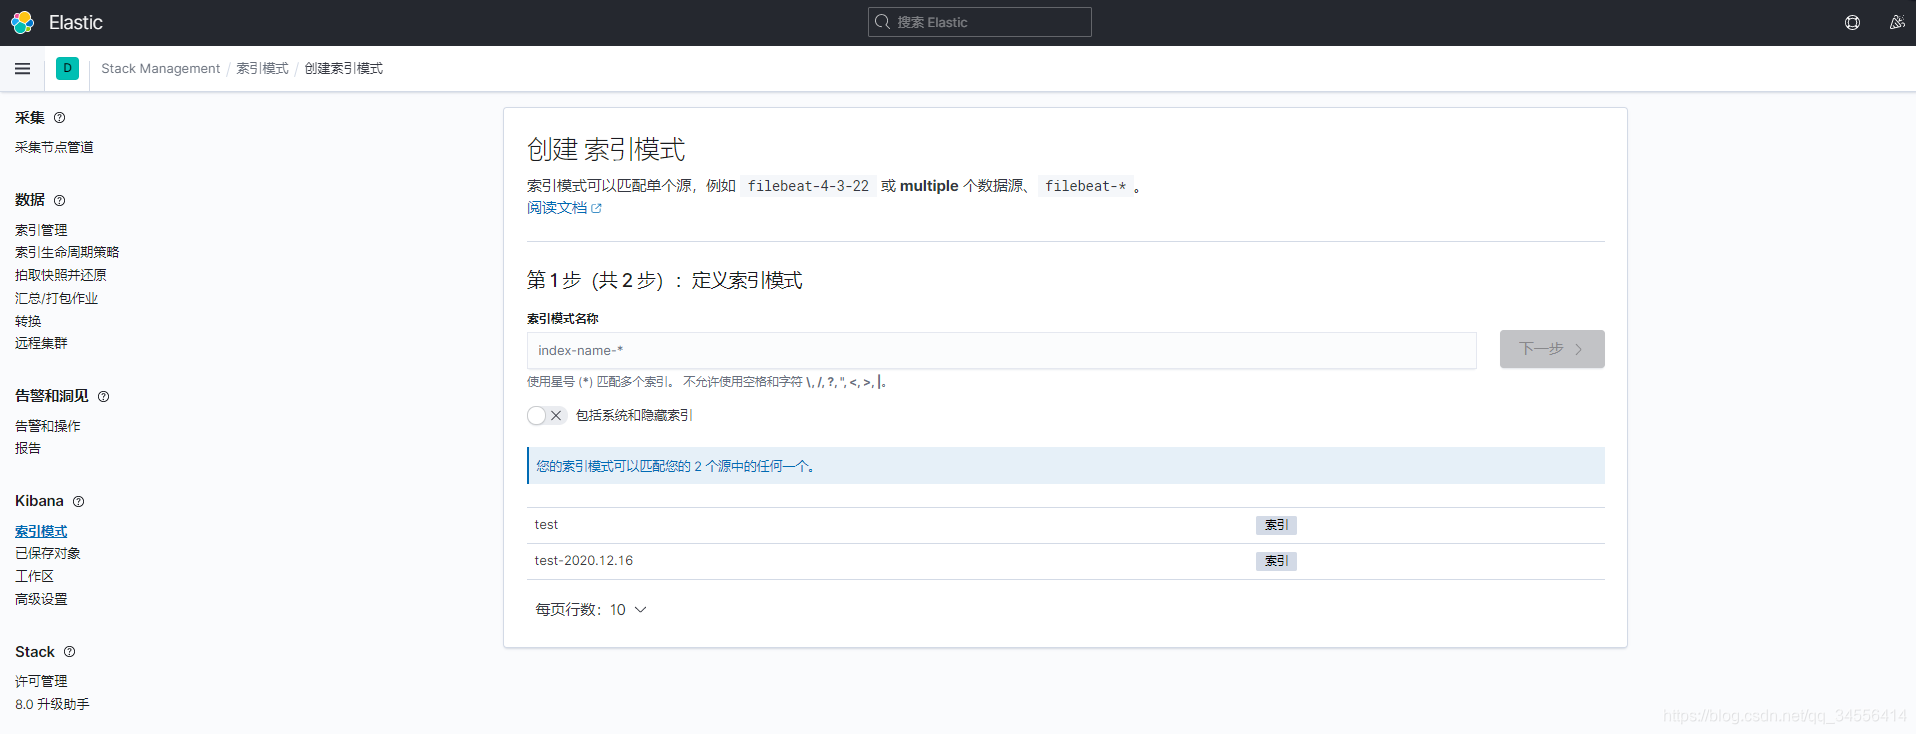
这里只会展示以test-开头所有的索引,因为这里的索引是按照天进行存储的,这样就可以匹配所有的天,这样好处是清理索引历史的日志,就可以针对天删除索引了。也就是删除数据库一样。
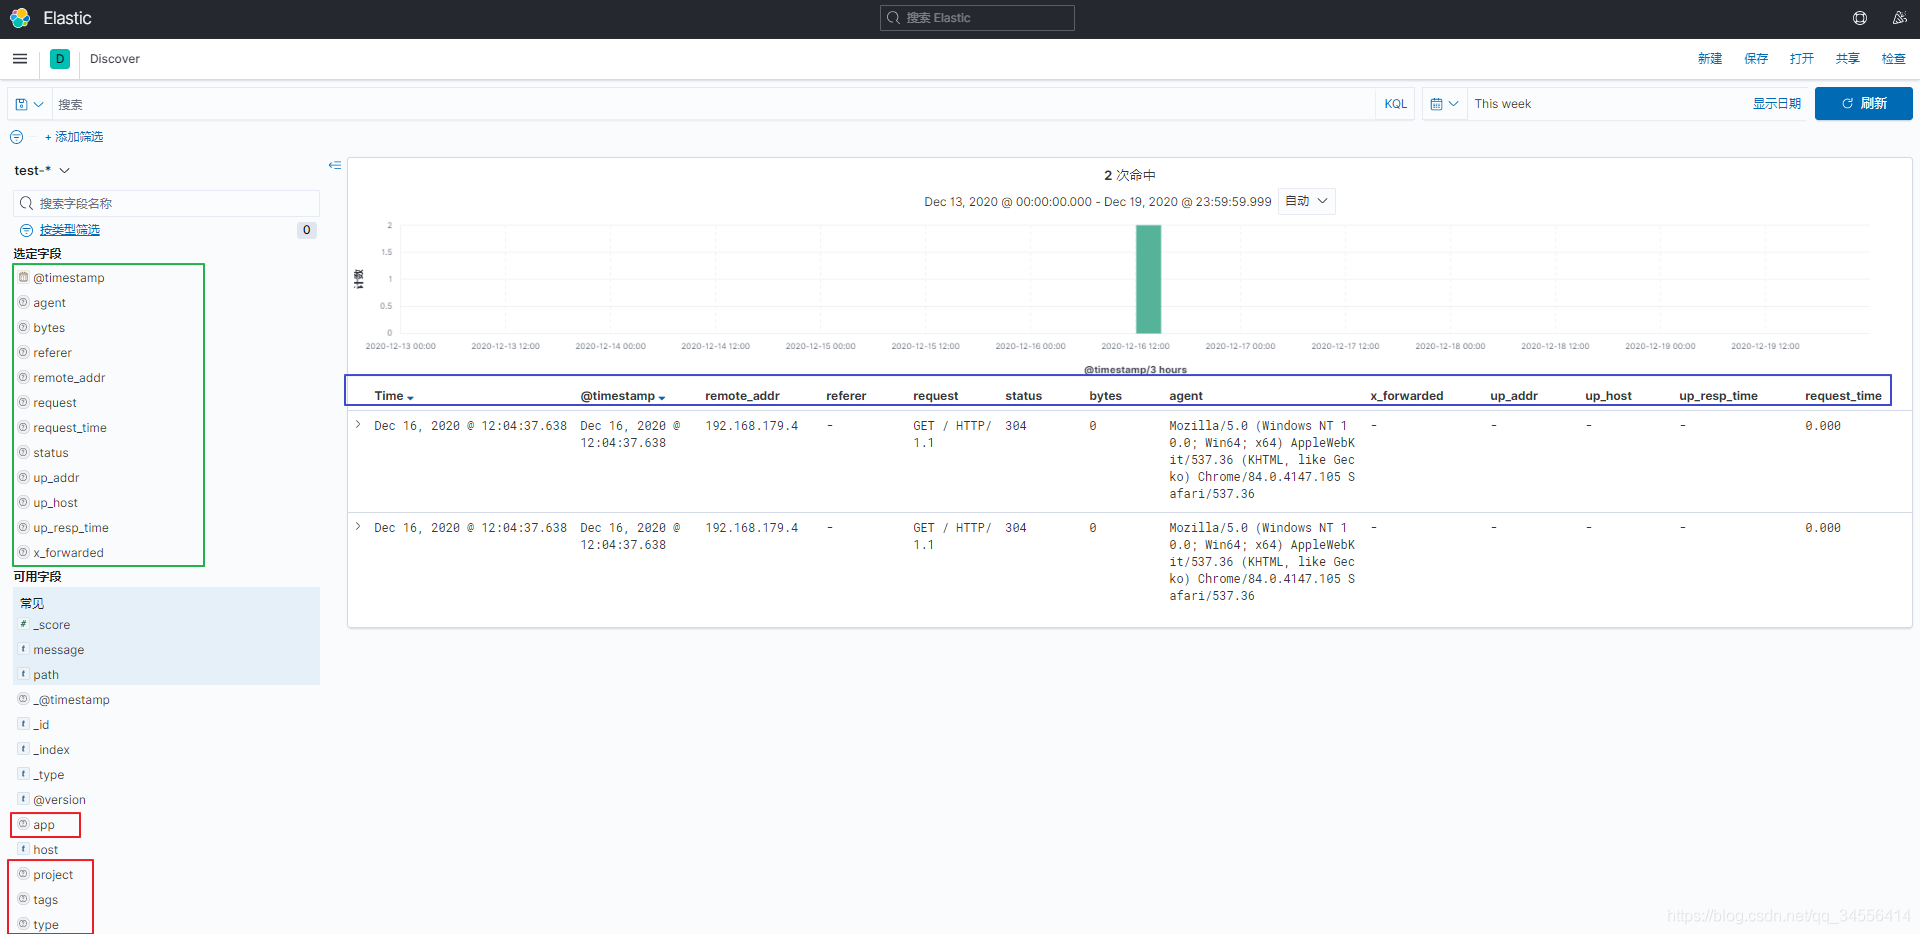
可以看到kibana可以根据这些字段查询出我们所需要的数据
可以看到这些字段很重要,这些字段可以标识出日志当中有哪些关键字段,从而根据这些字段查询我们需要的数据。可以看到通过json过滤模块格式化处理解析为顶层的字段
目录 返回
首页