在 Kubernetes 上手动部署 Prometheus
我们知道监控是保证系统运行必不可少的功能,特别是对于 Kubernetes 这种比较庞大的系统来说,监控报警更是不可或缺,我们需要时刻了解系统的各种运行指标,也需要时刻了解我们的 Pod 的各种指标,更需要在出现问题的时候有报警信息通知到我们。
在早期的版本中 Kubernetes 提供了 heapster、influxDB、grafana 的组合来监控系统,在现在的版本中已经移除掉了 heapster,现在更加流行的监控工具是 Prometheus,Prometheus 是 Google 内部监控报警系统的开源版本,是 Google SRE 思想在其内部不断完善的产物,它的存在是为了更快和高效的发现问题,快速的接入速度,简单灵活的配置都很好的解决了这一切,而且是已经毕业的 CNCF 项目。
简介
Prometheus 最初是 SoundCloud 构建的开源系统监控和报警工具,是一个独立的开源项目,于2016年加入了 CNCF 基金会,作为继 Kubernetes 之后的第二个托管项目。Prometheus 相比于其他传统监控工具主要有以下几个特点:
-
具有由 metric 名称和键/值对标识的时间序列数据的多维数据模型
-
有一个灵活的查询语言
-
不依赖分布式存储,只和本地磁盘有关
-
通过 HTTP 的服务拉取时间序列数据
-
也支持推送的方式来添加时间序列数据
-
还支持通过服务发现或静态配置发现目标
-
多种图形和仪表板支持
Prometheus 由多个组件组成,但是其中有些组件是可选的:
-
Prometheus Server:用于抓取指标、存储时间序列数据 -
exporter:暴露指标让任务来抓 -
pushgateway:push 的方式将指标数据推送到该网关 -
alertmanager:处理报警的报警组件adhoc:用于数据查询
大多数 Prometheus 组件都是用 Go 编写的,因此很容易构建和部署为静态的二进制文件。下图是 Prometheus 官方提供的架构及其一些相关的生态系统组件:
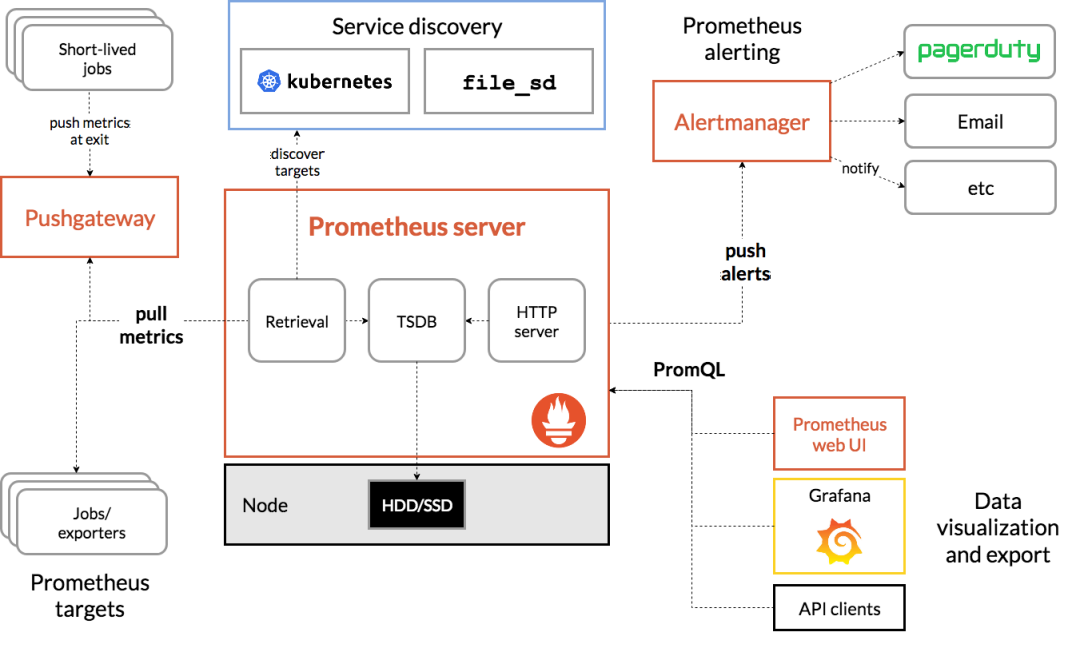
prometheus architecture
整体流程比较简单,Prometheus 直接接收或者通过中间的 Pushgateway 网关被动获取指标数据,在本地存储所有的获取的指标数据,并对这些数据进行一些规则整理,用来生成一些聚合数据或者报警信息,Grafana 或者其他工具用来可视化这些数据。
安装
由于 Prometheus 是 Golang 编写的程序,所以要安装的话也非常简单,只需要将二进制文件下载下来直接执行即可,前往地址:https://prometheus.io/download 下载最新版本即可。
Prometheus 是通过一个 YAML 配置文件来进行启动的,如果我们使用二进制的方式来启动的话,可以使用下面的命令:
$ ./prometheus --config.file=prometheus.yml
其中 prometheus.yml 文件的基本配置如下:
global:
  scrape_interval:     15s
  evaluation_interval: 15s

rule_files:
  # - "first.rules"
  # - "second.rules"

scrape_configs:
  - job_name: prometheus
    static_configs:
      - targets: ['localhost:9090']
上面这个配置文件中包含了3个模块:global、rule_files 和 scrape_configs。
-
global模块控制Prometheus Server的全局配置:-
scrape_interval:表示 prometheus 抓取指标数据的频率,默认是15s,我们可以覆盖这个值 -
evaluation_interval:用来控制评估规则的频率,prometheus 使用规则产生新的时间序列数据或者产生警报
-
-
rule_files:指定了报警规则所在的位置,prometheus 可以根据这个配置加载规则,用于生成新的时间序列数据或者报警信息,当前我们没有配置任何报警规则。 -
scrape_configs用于控制 prometheus 监控哪些资源。
由于 prometheus 通过 HTTP 的方式来暴露的它本身的监控数据,prometheus 也能够监控本身的健康情况。在默认的配置里有一个单独的 job,叫做 prometheus,它采集 prometheus 服务本身的时间序列数据。这个 job 包含了一个单独的、静态配置的目标:监听 localhost 上的 9090 端口。prometheus 默认会通过目标的 /metrics 路径采集 metrics。所以,默认的 job 通过 URL:http://localhost:9090/metrics 采集 metrics。收集到的时间序列包含 prometheus 服务本身的状态和性能。如果我们还有其他的资源需要监控的话,直接配置在 scrape_configs 模块下面就可以了。
示例应用
比如我们在本地启动一些样例来让 Prometheus 采集。Go 客户端库包含一个示例,该示例为具有不同延迟分布的三个服务暴露 RPC 延迟。
首先确保已经安装了 Go 环境并启用 go modules,下载 Prometheus 的 Go 客户端库并运行这三个示例:
$ git clone https://github.com/prometheus/client_golang.git
$ cd client_golang/examples/random
$ export GO111MODULE=on
$ export GOPROXY=https://goproxy.cn
$ go build
然后在3个独立的终端里面运行3个服务:
$ ./random -listen-address=:8080
$ ./random -listen-address=:8081
$ ./random -listen-address=:8082这个时候我们可以得到3个不同的监控接口:http://localhost:8080/metrics、http://localhost:8081/metrics 和 http://localhost:8082/metrics。
现在我们配置 Prometheus 来采集这些新的目标,让我们将这三个目标分组到一个名为 example-random 的任务。假设前两个端点(即:http://localhost:8080/metrics、http://localhost:8081/metrics)都是生产级目标应用,第三个端点(即:http://localhost:8082/metrics )为金丝雀实例。要在 Prometheus 中对此进行建模,我们可以将多组端点添加到单个任务中,为每组目标添加额外的标签。在此示例中,我们将 group =“production” 标签添加到第一组目标,同时将 group=“canary”添加到第二组。将以下配置添加到 prometheus.yml 中的 scrape_configs 部分,然后重新启动 Prometheus 实例:
scrape_configs:
  - job_name: 'example-random'
    # Override the global default and scrape targets from this job every 5 seconds.
    scrape_interval: 5s
    static_configs:
      - targets: ['localhost:8080', 'localhost:8081']
        labels:
          group: 'production'
      - targets: ['localhost:8082']
        labels:
          group: 'canary'
然后我们可以到浏览器中查看 Prometheus 的配置是否有新增的任务,这就是 Prometheus 添加监控配置最基本的配置方式了,非常简单,只需要提供一个符合 metrics 格式的可访问的接口配置给 Prometheus 就可以了。
但是由于我们这里是要运行在 Kubernetes 系统中,所以我们直接用 Docker 镜像的方式运行。
为了能够方便的管理配置文件,我们这里将 prometheus.yml 文件用 ConfigMap 的形式进行管理:
# prometheus-cm.yaml
apiVersion: v1
kind: ConfigMap
metadata:
  name: prometheus-config
  namespace: kube-mon
data:
  prometheus.yml: |
    global:
      scrape_interval: 15s
      scrape_timeout: 15s
    scrape_configs:
    - job_name: 'prometheus'
      static_configs:
      - targets: ['localhost:9090']
我们这里暂时只配置了对 prometheus 本身的监控,直接创建该资源对象:
$ kubectl apply -f prometheus-cm.yaml
configmap "prometheus-config" created配置文件创建完成了,以后如果我们有新的资源需要被监控,我们只需要将上面的 ConfigMap 对象更新即可。现在我们来创建 prometheus 的 Pod 资源:
# prometheus-deploy.yaml
apiVersion: apps/v1
kind: Deployment
metadata:
  name: prometheus
  namespace: kube-mon
  labels:
    app: prometheus
spec:
  selector:
    matchLabels:
      app: prometheus
  template:
    metadata:
      labels:
        app: prometheus
    spec:
      serviceAccountName: prometheus
      containers:
      - image: prom/prometheus:v2.24.1
        name: prometheus
        args:
        - "--config.file=/etc/prometheus/prometheus.yml"
        - "--storage.tsdb.path=/prometheus"  # 指定tsdb数据路径
        - "--storage.tsdb.retention.time=24h"
        - "--web.enable-admin-api"  # 控制对admin HTTP API的访问,其中包括删除时间序列等功能
        - "--web.enable-lifecycle"  # 支持热更新,直接执行localhost:9090/-/reload立即生效
        ports:
        - containerPort: 9090
          name: http
        volumeMounts:
        - mountPath: "/etc/prometheus"
          name: config-volume
        - mountPath: "/prometheus"
          name: data
        resources:
          requests:
            cpu: 100m
            memory: 512Mi
          limits:
            cpu: 100m
            memory: 512Mi
      volumes:
      - name: data
        persistentVolumeClaim:
          claimName: prometheus-data
      - configMap:
          name: prometheus-config
        name: config-volume
另外为了 prometheus 的性能和数据持久化我们这里是直接将通过一个 LocalPV 来进行数据持久化的,通过 --storage.tsdb.path=/prometheus 指定数据目录,创建如下所示的一个 PVC 资源对象,注意是一个 LocalPV,和 node3 节点具有亲和性:
apiVersion: v1
kind: PersistentVolume
metadata:
  name: prometheus-local
  labels:
    app: prometheus
spec:
  accessModes:
  - ReadWriteOnce
  capacity:
    storage: 20Gi
  storageClassName: local-storage
  local:
    path: /data/k8s/prometheus
  nodeAffinity:
    required:
      nodeSelectorTerms:
      - matchExpressions:
        - key: kubernetes.io/hostname
          operator: In
          values:
          - node3
  persistentVolumeReclaimPolicy: Retain
---
apiVersion: v1
kind: PersistentVolumeClaim
metadata:
  name: prometheus-data
  namespace: kube-mon
spec:
  selector:
    matchLabels:
      app: prometheus
  accessModes:
  - ReadWriteOnce
  resources:
    requests:
      storage: 20Gi
  storageClassName: local-storage
由于 prometheus 可以访问 Kubernetes 的一些资源对象,所以需要配置 rbac 相关认证,这里我们使用了一个名为 prometheus 的 serviceAccount 对象:
# prometheus-rbac.yaml
apiVersion: v1
kind: ServiceAccount
metadata:
  name: prometheus
  namespace: kube-mon
---
apiVersion: rbac.authorization.k8s.io/v1
kind: ClusterRole
metadata:
  name: prometheus
rules:
- apiGroups:
  - ""
  resources:
  - nodes
  - services
  - endpoints
  - pods
  - nodes/proxy
  verbs:
  - get
  - list
  - watch
- apiGroups:
  - "extensions"
  resources:
    - ingresses
  verbs:
  - get
  - list
  - watch
- apiGroups:
  - ""
  resources:
  - configmaps
  - nodes/metrics
  verbs:
  - get
- nonResourceURLs:
  - /metrics
  verbs:
  - get
---
apiVersion: rbac.authorization.k8s.io/v1beta1
kind: ClusterRoleBinding
metadata:
  name: prometheus
roleRef:
  apiGroup: rbac.authorization.k8s.io
  kind: ClusterRole
  name: prometheus
subjects:
- kind: ServiceAccount
  name: prometheus
namespace: kube-mon目录 返回
首页