ELK之十----logstash结合filebeat将日志存储到redis,再由logstash转存到elasticsearch
实战一:filebeat收集日志到redis再由logstash转存到elasticsearch主机
框架图:

环境准备:
A主机:elasticsearch/kibana IP地址:192.168.7.100
B主机:logstash IP地址:192.168.7.102
C主机:filebeat/nginx IP地址:192.168.7.103
D主机: redis IP地址: 192.168.7.104
1、filebeat收集系统和nginx日志到redis主机
1.1、安装redis服务,并修改配置
1、安装redis服务
# yum install redis -y
2、修改redis配置文件,修改监听地址和密码
[root@web1 ~]# vim /etc/redis.conf
bind 0.0.0.0
requirepasswd 123456
3、启动redis服务
# systemctl start redis
1.2、修改filebeat主机配置,将日志存到redis服务器上
1、修改filebeat主机配置文件,将日志存储到redis服务器上
[root@filebate tmp]# vim /etc/filebeat/filebeat.yml
filebeat.inputs:
- type: log
  enabled: true
  paths:
    - /var/log/messages
  fields:
    host: "192.168.7.103"
    type: "filebeat-syslog-7-103"
    app: "syslog"
- type: log
  enabled: true
  paths:
    - /var/log/nginx/access.log
  fields:
    host: "192.168.7.103"
    type: "filebeat-nginx-accesslog-7-103"
    app: "nginx"

output.redis:
  hosts: ["192.168.7.104"] # 写入redis服务器主机IP地址
  port: 6379 # redis监听的端口号
  password: "123456" # redis密码
  key: "filebeat-log-7-103"  # 自定义的key
  db: 0  # 选择默认的数据库
  timeout: 5  #超时时长,可以修改再大点
2、查看filebeat的关键信息
[root@filebate tmp]# grep -v "#" /etc/filebeat/filebeat.yml | grep -v "^$"
filebeat.inputs:
- type: log
  enabled: true
  paths:
    - /var/log/messages
  fields:
    host: "192.168.7.103"
    type: "filebeat-syslog-7-103"
    app: "syslog"
- type: log
  enabled: true
  paths:
    - /var/log/nginx/access.log
  fields:
    host: "192.168.7.103"
    type: "filebeat-nginx-accesslog-7-103"
    app: "nginx"
filebeat.config.modules:
  path: ${path.config}/modules.d/*.yml
  reload.enabled: false
setup.template.settings:
  index.number_of_shards: 3
setup.kibana:
processors:
  - add_host_metadata: ~
  - add_cloud_metadata: ~
output.redis:
  hosts: ["192.168.7.104"]
  port: 6379
  password: "123456"
  key: "filebeat-log-7-103"
  db: 0
  timeout: 5
3、启动filebeat服务
# systemctl restart filebeat
2、在redis主机上测试验证数据
1、登陆redis客户端查看数据,此时可以看到对应的key值已经到达,说明数据可以到达redis服务器。
[root@web1 ~]# redis-cli -h 192.168.7.104
192.168.7.104:6379> auth 123456
OK
192.168.7.104:6379> KEYS *
1) "filebeat-log-7-103"
192.168.7.104:6379>
3、在logstash收集redis服务器的日志
1、修改logstash配置文件,收集redis日志
[root@logstash conf.d]# vim logstash-to-es.conf
input {
   redis {
     host => "192.168.7.104"  # redis主机的IP地址
     port => "6379" # 端口
     db => "0"  # 与filebeat对应的数据库
     password => "123456" #密码
     data_type => "list"  # 日志类型
     key => "filebeat-log-7-103" # 与filebeat对应的key值
     codec => "json"
   }
}


output {
  if [fields][app] == "syslog" {  # 与filebeat主机的app类型一致
    elasticsearch {
      hosts => ["192.168.7.100:9200"] # 日志转到elasticsearch主机上
      index => "logstash-syslog-7-103-%{+YYYY.MM.dd}"
    }}

  if [fields][app] == "nginx" { # 与filebeat主机的app类型一致
    elasticsearch {
      hosts => ["192.168.7.100:9200"]
      index => "logstash-nginx-accesslog-7-103-%{+YYYY.MM.dd}"
    }}
}
检查语法是否存在问题,如果不存在问题就启动服务
[root@logstash conf.d]# logstash -f  logstash-to-es.conf  -t
WARNING: Could not find logstash.yml which is typically located in $LS_HOME/config or /etc/logstash. You can specify the path using --path.settings. Continuing using the defaults
Could not find log4j2 configuration at path /usr/share/logstash/config/log4j2.properties. Using default config which logs errors to the console
[WARN ] 2020-03-16 10:05:05.487 [LogStash::Runner] multilocal - Ignoring the 'pipelines.yml' file because modules or command line options are specified
Configuration OK  # 检查语法正确
[INFO ] 2020-03-16 10:05:16.597 [LogStash::Runner] runner - Using config.test_and_exit mode. Config Validation Result: OK. Exiting Logstash
2、重启logstash服务器
# systemctl restart logstash
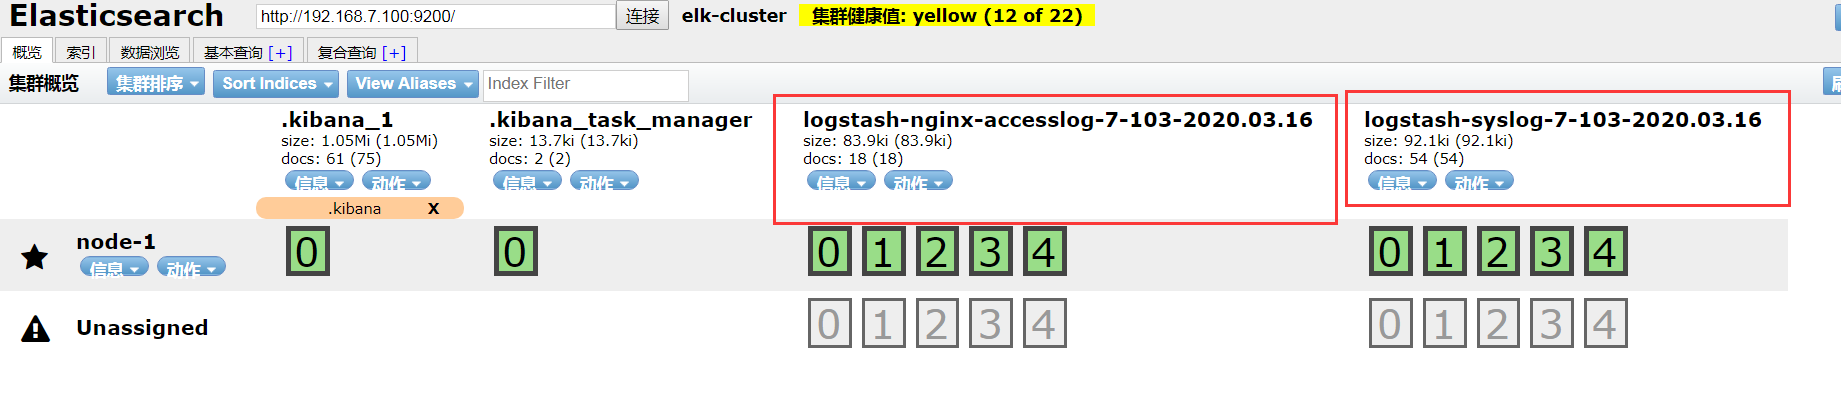
3、查看head插件收集的日志名称,此时就可以看到日志提取到的信息
4、在kibana网页上创建索引
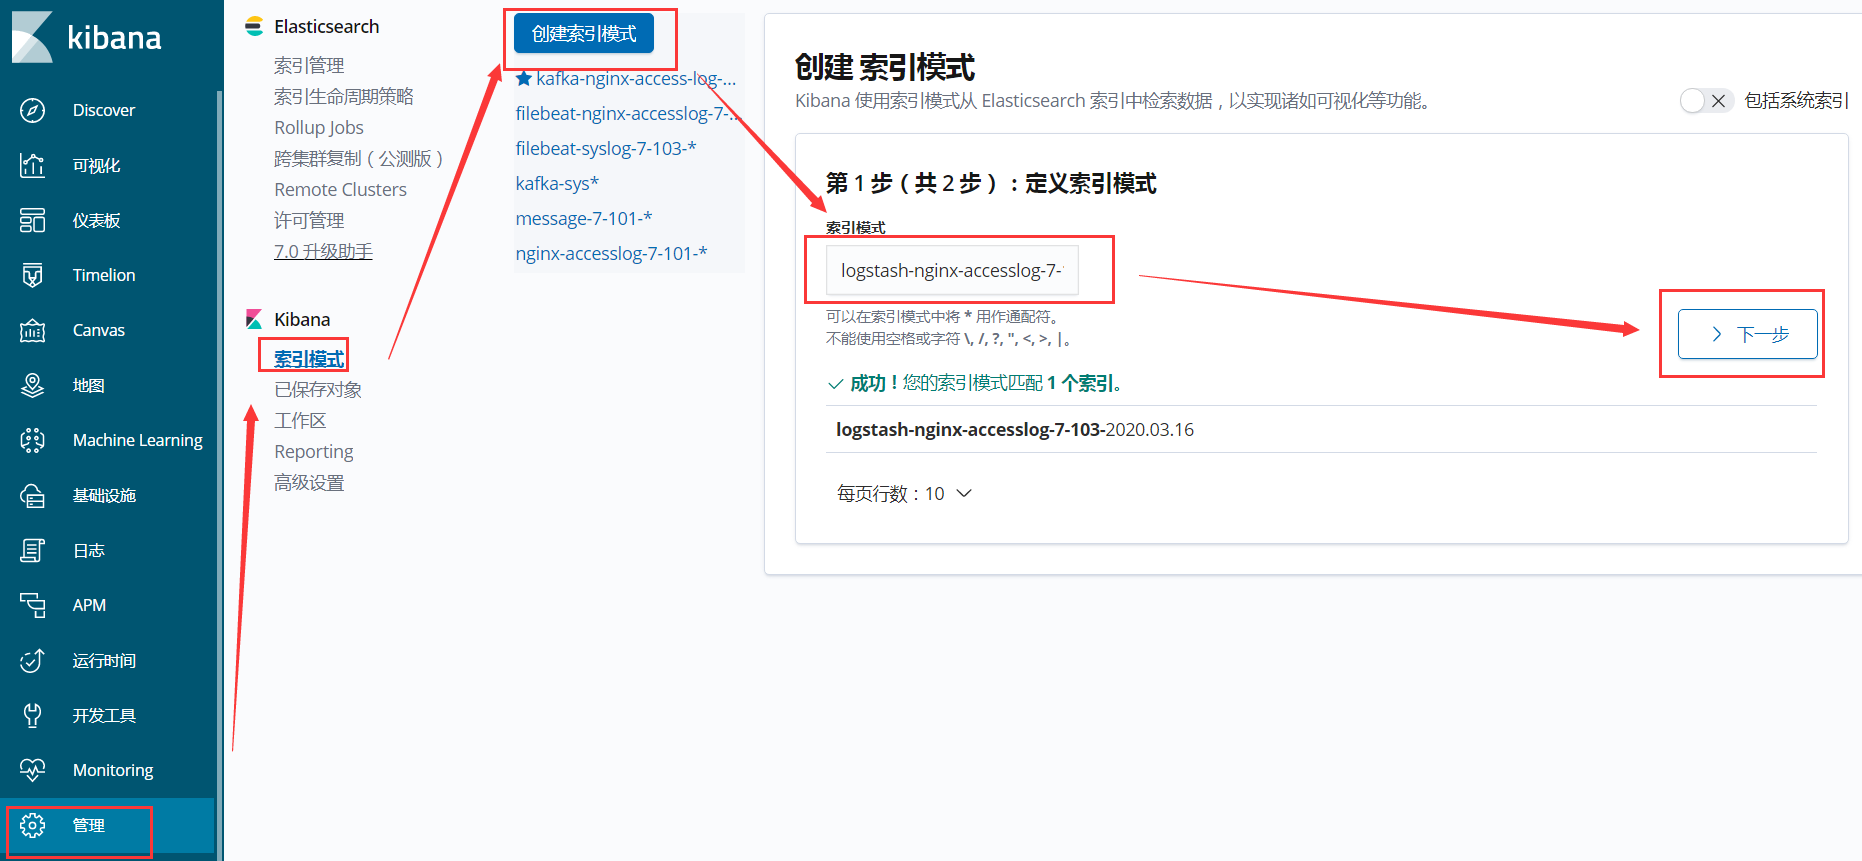
1、在kibana网页上创建Nginx日志索引,同理系统日志也可以这样创建
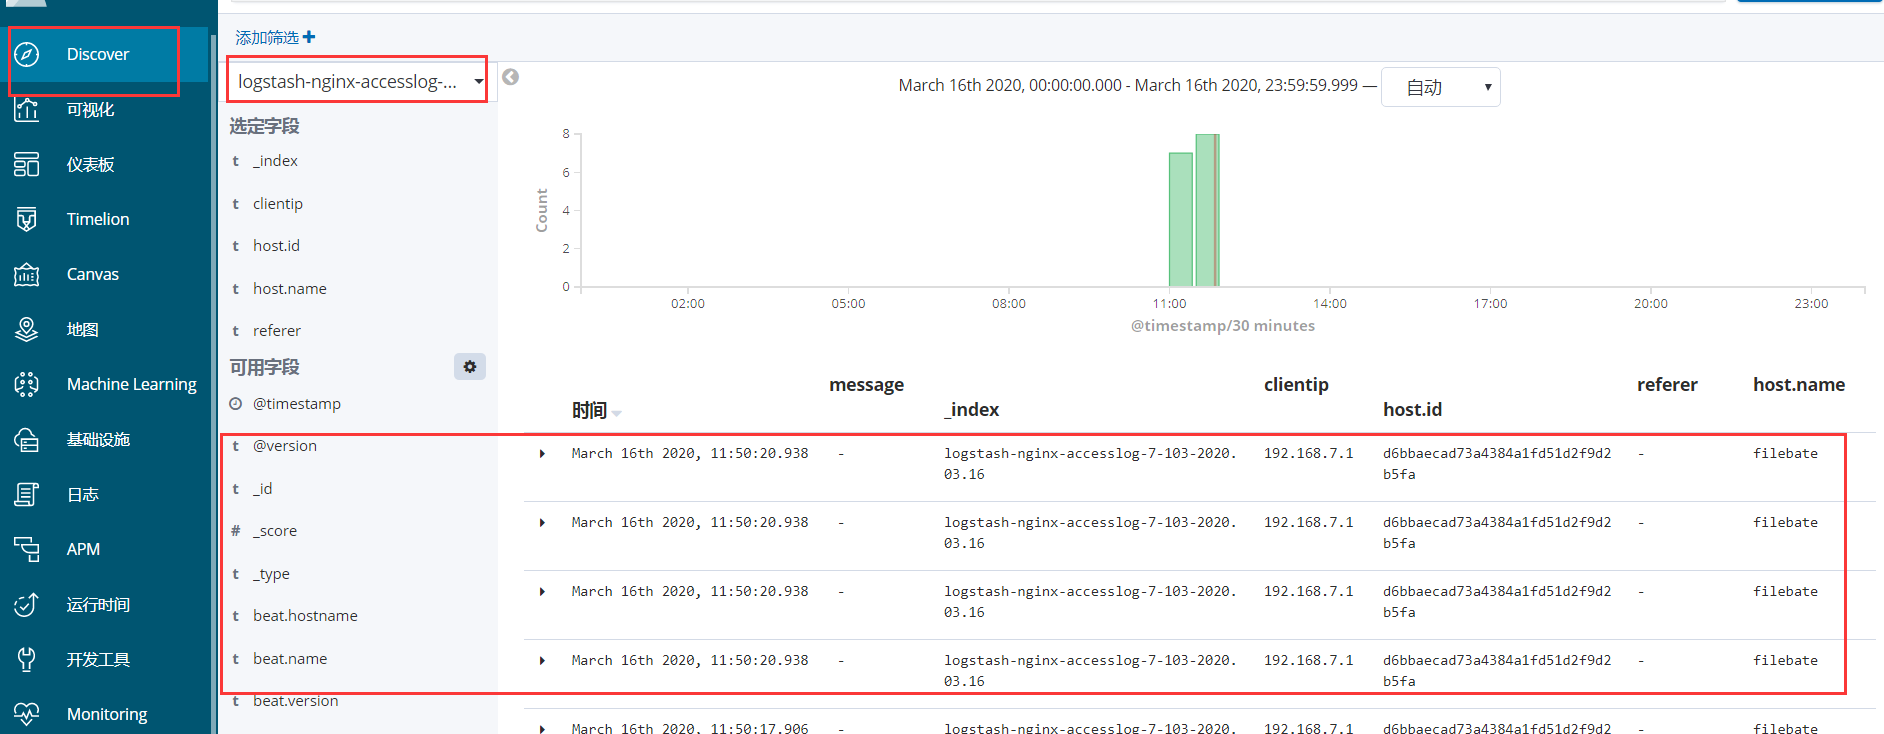
2、在discover查看提取到的nginx日志数据

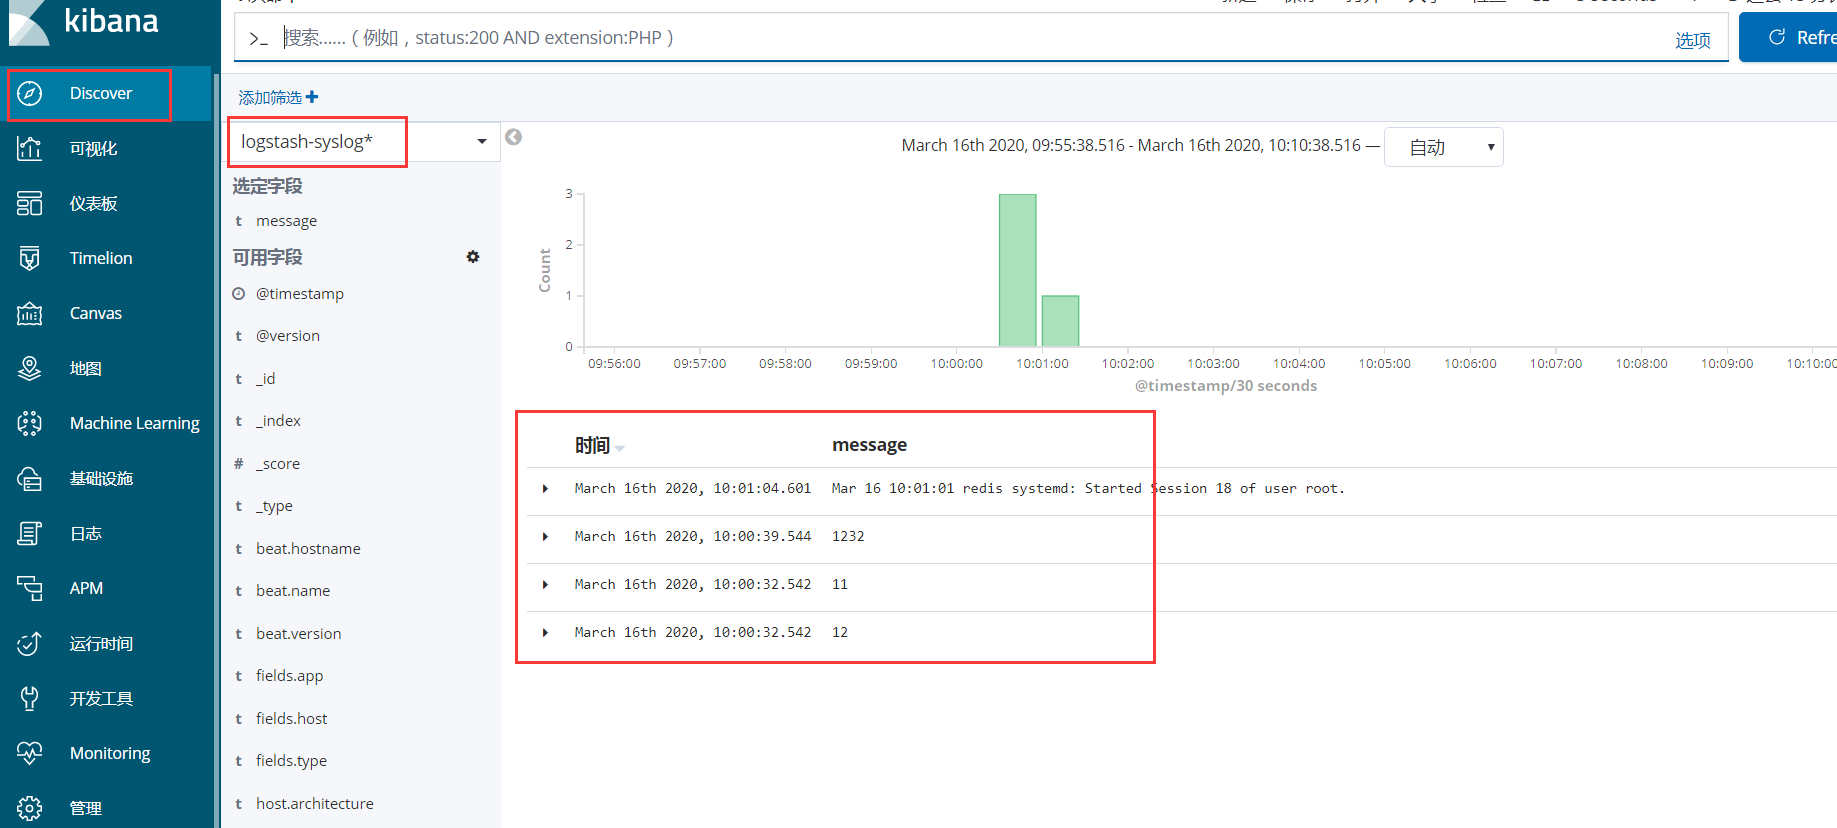
3、查看收集到的系统日志
实战二:logstash结合filebeat收集到redis日志,并转存到elasticsearch主机
框架图:

环境准备:
这里没有太多测试主机,都是以单机形式测试,生产环境可以按上面的部署
A主机:elasticsearch/kibana IP地址:192.168.7.100
B主机:logstash-A IP地址:192.168.7.102
C主机:filebeat/nginx IP地址:192.168.7.103
D主机: redis IP地址: 192.168.7.104
E主机: logstash-B IP地址:192.168.7.101
1、安装并配置filebeat主机
1、安装filebeat包,这里需要在官网上下载包
[root@filebeat-1 ~]# yum install filebeat-6.8.1-x86_64.rpm -y
2、修改filebeat配置文件,将日志由filebeat传递到第一个logstash主机上,如果有多个filebeat对多个logstash主机进行转存日志,可以在output.logstash配置段,写入不同的logstash主机的IP地址
[root@filebate ~]# grep -v "#" /etc/filebeat/filebeat.yml  | grep -v "^$"
filebeat.inputs:
- type: log
  enabled: true
  paths:
    - /var/log/messages
  fields:
    host: "192.168.7.103"
    type: "filebeat-syslog-7-103"
    app: "syslog"
- type: log
  enabled: true
  paths:
    - /var/log/nginx/access.log
  fields:
    host: "192.168.7.103" # 指定本机的IP地址
    type: "filebeat-nginx-accesslog-7-103"
    app: "nginx"
output.logstash:
  hosts: ["192.168.7.101:5044"] # 写到指定的logstash服务器上,如果有多个filebeat主机传递到不同logstash主机时,可以在另一个filebeat主机上写上另一个logstash主机的IP地址
  enabled: true # 是否传递到logstash服务器,默认是开启
  work: 1 # 工作线程
  compression_level: 3  # 压缩等级
3、重启filebeat服务
# systemctl restart filebeat
2、修改logstash-B主机,将日志存储到redis服务器上
1、在/etc/logstash/conf.d/目录下创建一个存储到redis日志的配置文件,如果有多个filebeat、logstash和redis,可以分别对redis主机进行存储日志,减少logstash压力
[root@logstash-1 conf.d]# cat  filebeat-to-logstash.conf
input {
  beats {
    host => "192.168.7.101" # logstash主机的IP地址,如果还有其他logstash主机转存到redis主机上,可以在另一台logstash主机上写入对应本机的IP地址,分担logstash主机的压力
    port => 5044  # 端口号
    codec => "json"
  }
}


output {
  if [fields][app] == "syslog" {
  redis {
       host => "192.168.7.104" #  存储到redis服务器地址
       port => "6379"
       db => "0"
       data_type => "list"
       password => "123456"
       key =>  "filebeat-syslog-7-103"  #定义不同日志的key,方便区分
       codec => "json"
  }}

  if [fields][app] == "nginx" {
  redis {
       host => "192.168.7.104"
       port => "6379"
       db => "0"
       data_type => "list"
       password => "123456"
       key =>  "filebeat-nginx-log-7-103" # 定义不同的key,方便分析
       codec => "json"
  }
}
}
2、对logstash主机进行测试
[root@logstash-1 conf.d]# logstash -f filebeat-to-logstash.conf  -t
WARNING: Could not find logstash.yml which is typically located in $LS_HOME/config or /etc/logstash. You can specify the path using --path.settings. Continuing using the defaults
Could not find log4j2 configuration at path /usr/share/logstash/config/log4j2.properties. Using default config which logs errors to the console
[WARN ] 2020-03-16 11:23:31.687 [LogStash::Runner] multilocal - Ignoring the 'pipelines.yml' file because modules or command line options are specified
Configuration OK  # 测试配置文件正常
重新启动logstash服务
# systemctl restart logstash
3、此时在redis主机上可以看到两个key值,说明logstash主机已经将日志存到redis主机上
[root@web1 ~]# redis-cli -h 192.168.7.104
192.168.7.104:6379> auth 123456
OK
192.168.7.104:6379> KEYS *
1) "filebeat-nginx-log-7-103"
2) "filebeat-syslog-7-103"
3、在logstash-A主机上配置提取redis的日志并转存到elasticsearch主机上
1、在logstash主机的/etc/logstash/conf.d目录下创建一个提取redis主机的日志
[root@logstash conf.d]# cat  logstash-to-es.conf
input {
   redis {
     host => "192.168.7.104" # redis主机的IP地址
     port => "6379"
     db => "0"
     password => "123456"
     data_type => "list"
     key => "filebeat-syslog-7-103" # 写入对应的filebeat的key值
     codec => "json"
   }
   redis {
     host => "192.168.7.104" # redis主机的IP地址
     port => "6379"
     db => "0"
     password => "123456"
     data_type => "list"
     key => "filebeat-nginx-log-7-103"  # 针对filebeat写入的key值,
     codec => "json"
   }
}


output {
  if [fields][app] == "syslog" {  # 对应filebeat主机的app类型
    elasticsearch {
      hosts => ["192.168.7.100:9200"] # elasticsearch主机IP地址
      index => "logstash-syslog-7-103-%{+YYYY.MM.dd}"
    }}

  if [fields][app] == "nginx" {  # 对应filebeat主机的app类型
    elasticsearch {
      hosts => ["192.168.7.100:9200"]
      index => "logstash-nginx-accesslog-7-103-%{+YYYY.MM.dd}"
    }}
}
2、测试logstash主机的配置文件
[root@logstash conf.d]# logstash -f logstash-to-es.conf  -t
WARNING: Could not find logstash.yml which is typically located in $LS_HOME/config or /etc/logstash. You can specify the path using --path.settings. Continuing using the defaults
Could not find log4j2 configuration at path /usr/share/logstash/config/log4j2.properties. Using default config which logs errors to the console
[WARN ] 2020-03-16 11:31:30.943 [LogStash::Runner] multilocal - Ignoring the 'pipelines.yml' file because modules or command line options are specified
Configuration OK
3、重启logstash主机服务
# systemctl restart logstash
4、在head插件查看获取到的系统日志和nginx日志

4、在kibana创建索引,查看收集到的日志信息
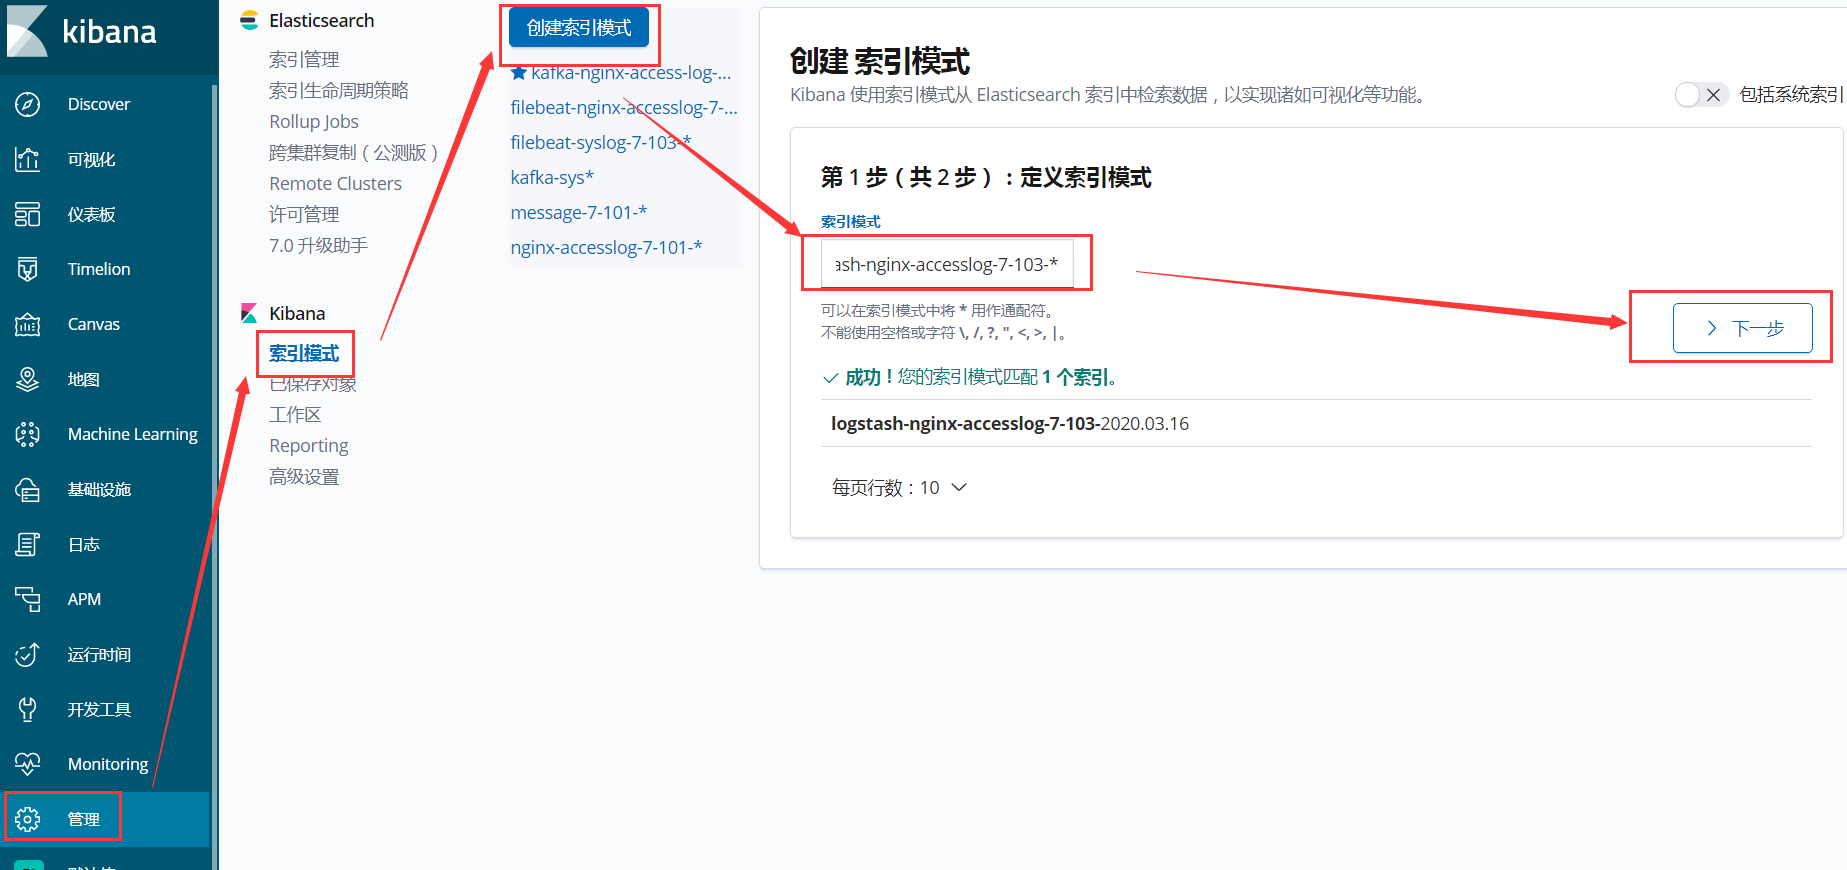
1、创建Nginx索引,系统日志索引同理
2、查看创建的索引信息
目录 返回
首页