Oracle之COUNT(1)、COUNT(*)不同写法性能比较
前言部分
导读和注意事项
各位技术爱好者,看完本文后,你可以掌握如下的技能,也可以学到一些其它你所不知道的知识,\~O(∩_∩)O\~:
① COUNT(1)和COUNT(*)的区别(重点)
② 10046和10053的使用
③ “SELECT COUNT(列)”和“SELECT 列”在选择索引方面的区别
④ COUNT计数的优化
实验环境介绍
| 项目 | source db |
|---|---|
| db 类型 | RAC |
| db version | 11.2.0.3.0 |
| db 存储 | ASM |
| OS版本及kernel版本 | RHEL 6.5 |
实验目标
弄清楚COUNT(1)、COUNT(*)、COUNT(常量)、COUNT(主键)、COUNT(ROWID)、COUNT(非空列)、COUNT(允许为空列)、COUNT(DISTINCT 列名)之间的区别,以及它们之间的效率问题。
实验过程
实验脚本
--创建1W行的表 DROP TABLE T_COUNT_LHR; CREATE TABLE T_COUNT_LHR AS SELECT OBJECT_ID, OBJECT_NAME, OWNER, DATA_OBJECT_ID, OBJECT_TYPE, LAST_DDL_TIME FROM DBA_OBJECTS D WHERE D.OBJECT_ID IS NOT NULL AND D.OBJECT_NAME IS NOT NULL AND ROWNUM <= 10000; --更新空值, UPDATE T_COUNT_LHR t SET t.object_type='' WHERE Rownum<=5; UPDATE T_COUNT_LHR t SET t.LAST_DDL_TIME=T.LAST_DDL_TIME+ROWNUM; UPDATE T_COUNT_LHR t SET t.LAST_DDL_TIME='' WHERE Rownum<=1; COMMIT; --添加主键、非空约束、唯一索引、普通索引 ALTER TABLE T_COUNT_LHR ADD CONSTRAINT PK_OBJECT_ID PRIMARY KEY(OBJECT_ID); ALTER TABLE T_COUNT_LHR MODIFY OBJECT_NAME NOT NULL; CREATE UNIQUE INDEX IDX_LDT ON T_COUNT_LHR(LAST_DDL_TIME); CREATE INDEX IDX_DATA_OBJECT_ID ON T_COUNT_LHR(DATA_OBJECT_ID); CREATE INDEX IDX_DATA_OWNER ON T_COUNT_LHR(OWNER); ALTER TABLE T_COUNT_LHR MODIFY OWNER NOT NULL; --收集统计信息 EXEC dbms_stats.gather_table_stats(USER,'T_COUNT_LHR'); SELECT d.COLUMN_NAME,d.DATA_TYPE,d.NUM_NULLS,d.NUM_DISTINCT,d.LAST_ANALYZED FROM cols d WHERE d.TABLE_NAME='T_COUNT_LHR';| 1 2 3 4 5 6 7 8 9 10 11 12 13 14 15 16 17 18 19 20 21 22 23 24 25 26 27 28 29 30 31 32 | --创建1W行的表 DROP TABLE T_COUNT_LHR; CREATE TABLE T_COUNT_LHR AS SELECT OBJECT_ID, OBJECT_NAME, OWNER, DATA_OBJECT_ID, OBJECT_TYPE, LAST_DDL_TIME FROM DBA_OBJECTS D WHERE D.OBJECT_ID IS NOT NULL AND D.OBJECT_NAME IS NOT NULL AND ROWNUM <= 10000; --更新空值, UPDATE T_COUNT_LHR t SET t.object_type= '' WHERE Rownum <=5; UPDATE T_COUNT_LHR t SET t.LAST_DDL_TIME =T.LAST_DDL_TIME + ROWNUM; UPDATE T_COUNT_LHR t SET t.LAST_DDL_TIME= '' WHERE Rownum <=1; COMMIT; --添加主键、非空约束、唯一索引、普通索引 ALTER TABLE T_COUNT_LHR ADD CONSTRAINT PK_OBJECT_ID PRIMARY KEY(OBJECT_ID); ALTER TABLE T_COUNT_LHR MODIFY OBJECT_NAME NOT NULL; CREATE UNIQUE INDEX IDX_LDT ON T_COUNT_LHR(LAST_DDL_TIME); CREATE INDEX IDX_DATA_OBJECT_ID ON T_COUNT_LHR(DATA_OBJECT_ID); CREATE INDEX IDX_DATA_OWNER ON T_COUNT_LHR(OWNER); ALTER TABLE T_COUNT_LHR MODIFY OWNER NOT NULL; --收集统计信息 EXEC dbms_stats.gather_table_stats( USER, 'T_COUNT_LHR'); SELECT d.COLUMN_NAME,d.DATA_TYPE,d.NUM_NULLS,d.NUM_DISTINCT,d.LAST_ANALYZED FROM cols d WHERE d.TABLE_NAME= 'T_COUNT_LHR'; |

表的信息如下所示:
| 列名 | 是否主键 | 是否允许为空 | 是否有索引 | 数据类型 | 空值的行数 | 不同值的行数 | 总行数 |
|---|---|---|---|---|---|---|---|
| OBJECT_ID | Y | N | 唯一索引 | NUMBER | 0 | 10000 | 10000 |
| OBJECT_NAME | N | 无 | VARCHAR2 | 0 | 8112 | 10000 | |
| OWNER | N | 普通索引(IDX_OWNER) | VARCHAR2 | 0 | 5 | 10000 | |
| DATA_OBJECT_ID | Y | 普通索引(IDX_DATA_OBJECT_ID) | NUMBER | 7645 | 2318 | 10000 | |
| OBJECT_TYPE | Y | 无 | VARCHAR2 | 5 | 20 | 10000 | |
| LAST_DDL_TIME | Y | 唯一索引(IDX_LDT) | DATE | 1 | 9999 | 10000 |
需要统计如下几种情况:
SELECT COUNT(1) FROM T_COUNT_LHR;--走索引 SELECT COUNT(*) FROM T_COUNT_LHR;--走索引 SELECT COUNT(ROWID) FROM T_COUNT_LHR; --走索引 SELECT COUNT(OBJECT_ID) FROM T_COUNT_LHR; --走索引 SELECT COUNT(OBJECT_NAME) FROM T_COUNT_LHR;--走索引 SELECT COUNT(OWNER) FROM T_COUNT_LHR D;--走索引 SELECT COUNT(D.DATA_OBJECT_ID) FROM T_COUNT_LHR D; --走索引 SELECT COUNT(D.LAST_DDL_TIME) FROM T_COUNT_LHR D;--走索引 SELECT COUNT(D.LAST_DDL_TIME) FROM T_COUNT_LHR D WHERE D.LAST_DDL_TIME IS NOT NULL;--走索引 SELECT D.LAST_DDL_TIME FROM T_COUNT_LHR D; --不走索引 SELECT D.LAST_DDL_TIME FROM T_COUNT_LHR D WHERE D.LAST_DDL_TIME IS NOT NULL;--走索引 SELECT COUNT(DISTINCT DATA_OBJECT_ID) FROM T_COUNT_LHR D;--不走索引 SELECT COUNT(DISTINCT OWNER) FROM T_COUNT_LHR D;--走索引 SELECT COUNT(DISTINCT DATA_OBJECT_ID) FROM T_COUNT_LHR D WHERE DATA_OBJECT_ID IS NOT NULL ;--走索引| 1 2 3 4 5 6 7 8 9 10 11 12 13 14 15 | SELECT COUNT(1) FROM T_COUNT_LHR;--走索引 SELECT COUNT(*) FROM T_COUNT_LHR;--走索引 SELECT COUNT( ROWID) FROM T_COUNT_LHR; --走索引 SELECT COUNT(OBJECT_ID) FROM T_COUNT_LHR; --走索引 SELECT COUNT(OBJECT_NAME) FROM T_COUNT_LHR;--走索引 SELECT COUNT(OWNER) FROM T_COUNT_LHR D;--走索引 SELECT COUNT(D.DATA_OBJECT_ID) FROM T_COUNT_LHR D; --走索引 SELECT COUNT(D.LAST_DDL_TIME) FROM T_COUNT_LHR D;--走索引 SELECT COUNT(D.LAST_DDL_TIME) FROM T_COUNT_LHR D WHERE D.LAST_DDL_TIME IS NOT NULL;--走索引 SELECT D.LAST_DDL_TIME FROM T_COUNT_LHR D; --不走索引 SELECT D.LAST_DDL_TIME FROM T_COUNT_LHR D WHERE D.LAST_DDL_TIME IS NOT NULL;--走索引 SELECT COUNT( DISTINCT DATA_OBJECT_ID) FROM T_COUNT_LHR D;--不走索引 SELECT COUNT( DISTINCT OWNER) FROM T_COUNT_LHR D;--走索引 SELECT COUNT( DISTINCT DATA_OBJECT_ID) FROM T_COUNT_LHR D WHERE DATA_OBJECT_ID IS NOT NULL ;--走索引 |
执行计划


10046事件
alter session set events '10046 trace name context forever, level 12'; SELECT COUNT(*) FROM T_COUNT_LHR; alter system flush buffer_cache; alter system flush shared_pool; SELECT COUNT(1) FROM T_COUNT_LHR; alter system flush buffer_cache; alter system flush shared_pool; SELECT COUNT(ROWID) FROM T_COUNT_LHR; alter session set events '10046 trace name context OFF'; select value from v$diag_info where name like '%Default%'; exit tkprof orclasm_ora_13825.trc orclasm_ora_13825.out alter system flush buffer_cache; alter system flush shared_pool; alter session set sql_trace=true; SELECT COUNT(*) FROM T_COUNT_LHR; alter system flush buffer_cache; alter system flush shared_pool; SELECT COUNT(1) FROM T_COUNT_LHR; alter system flush buffer_cache; alter system flush shared_pool; SELECT COUNT(ROWID) FROM T_COUNT_LHR; alter session set sql_trace=false; select value from v$diag_info where name like '%Default%'; ******************************************************************************** count = number of times OCI procedure was executed cpu = cpu time in seconds executing elapsed = elapsed time in seconds executing disk = number of physical reads of buffers from disk query = number of buffers gotten for consistent read current = number of buffers gotten in current mode (usually for update) rows = number of rows processed by the fetch or execute call ******************************************************************************** SQL ID: g9rksvy7gkdmj Plan Hash: 1265209789 SELECT COUNT(*) FROM T_COUNT_LHR call count cpu elapsed disk query current rows ------- ------ -------- ---------- ---------- ---------- ---------- ---------- Parse 1 0.00 0.00 0 0 0 0 Execute 1 0.00 0.00 0 0 0 0 Fetch 2 0.00 0.55 22 25 0 1 ------- ------ -------- ---------- ---------- ---------- ---------- ---------- total 4 0.01 0.56 22 25 0 1 Misses in library cache during parse: 1 Optimizer mode: ALL_ROWS Parsing user id: 90 Number of plan statistics captured: 1 Rows (1st) Rows (avg) Rows (max) Row Source Operation ---------- ---------- ---------- --------------------------------------------------- 1 1 1 SORT AGGREGATE (cr=25 pr=22 pw=0 time=552894 us) 10000 10000 10000 INDEX FAST FULL SCAN PK_OBJECT_ID (cr=25 pr=22 pw=0 time=2502 us cost=7 size=0 card=10000)(object id 159543) ******************************************************************************** SQL ID: 4abkxq9x7uamj Plan Hash: 1265209789 SELECT COUNT(1) FROM T_COUNT_LHR call count cpu elapsed disk query current rows ------- ------ -------- ---------- ---------- ---------- ---------- ---------- Parse 1 0.00 0.01 0 0 0 0 Execute 1 0.00 0.00 0 0 0 0 Fetch 2 0.00 0.00 22 25 0 1 ------- ------ -------- ---------- ---------- ---------- ---------- ---------- total 4 0.00 0.01 22 25 0 1 Misses in library cache during parse: 1 Optimizer mode: ALL_ROWS Parsing user id: 90 Number of plan statistics captured: 1 Rows (1st) Rows (avg) Rows (max) Row Source Operation ---------- ---------- ---------- --------------------------------------------------- 1 1 1 SORT AGGREGATE (cr=25 pr=22 pw=0 time=5934 us) 10000 10000 10000 INDEX FAST FULL SCAN PK_OBJECT_ID (cr=25 pr=22 pw=0 time=2469 us cost=7 size=0 card=10000)(object id 159543) ******************************************************************************** SQL ID: 4tm3jwzff8ub8 Plan Hash: 1265209789 SELECT COUNT(ROWID) FROM T_COUNT_LHR call count cpu elapsed disk query current rows ------- ------ -------- ---------- ---------- ---------- ---------- ---------- Parse 1 0.00 0.00 0 0 0 0 Execute 1 0.00 0.00 0 0 0 0 Fetch 2 0.00 0.01 22 25 0 1 ------- ------ -------- ---------- ---------- ---------- ---------- ---------- total 4 0.00 0.01 22 25 0 1 Misses in library cache during parse: 1 Optimizer mode: ALL_ROWS Parsing user id: 90 Number of plan statistics captured: 1 Rows (1st) Rows (avg) Rows (max) Row Source Operation ---------- ---------- ---------- --------------------------------------------------- 1 1 1 SORT AGGREGATE (cr=25 pr=22 pw=0 time=11264 us) 10000 10000 10000 INDEX FAST FULL SCAN PK_OBJECT_ID (cr=25 pr=22 pw=0 time=762 us cost=7 size=120000 card=10000)(object id 159543) ********************************************************************************| 1 2 3 4 5 6 7 8 9 10 11 12 13 14 15 16 17 18 19 20 21 22 23 24 25 26 27 28 29 30 31 32 33 34 35 36 37 38 39 40 41 42 43 44 45 46 47 48 49 50 51 52 53 54 55 56 57 58 59 60 61 62 63 64 65 66 67 68 69 70 71 72 73 74 75 76 77 78 79 80 81 82 83 84 85 86 87 88 89 90 91 92 93 94 95 96 97 98 99 100 101 102 103 104 105 106 107 108 109 110 111 112 113 114 115 116 | alter session set events '10046 trace name context forever, level 12'; SELECT COUNT(*) FROM T_COUNT_LHR; alter system flush buffer_cache; alter system flush shared_pool; SELECT COUNT(1) FROM T_COUNT_LHR; alter system flush buffer_cache; alter system flush shared_pool; SELECT COUNT( ROWID) FROM T_COUNT_LHR; alter session set events '10046 trace name context OFF'; select value from v$diag_info where name like '%Default%'; exit tkprof orclasm_ora_13825.trc orclasm_ora_13825.out alter system flush buffer_cache; alter system flush shared_pool; alter session set sql_trace = true; SELECT COUNT(*) FROM T_COUNT_LHR; alter system flush buffer_cache; alter system flush shared_pool; SELECT COUNT(1) FROM T_COUNT_LHR; alter system flush buffer_cache; alter system flush shared_pool; SELECT COUNT( ROWID) FROM T_COUNT_LHR; alter session set sql_trace = false; select value from v$diag_info where name like '%Default%'; ******************************************************************************** count = number of times OCI procedure was executed cpu = cpu time in seconds executing elapsed = elapsed time in seconds executing disk = number of physical reads of buffers from disk query = number of buffers gotten for consistent read current = number of buffers gotten in current mode (usually for update) rows = number of rows processed by the fetch or execute call ******************************************************************************** SQL ID: g9rksvy7gkdmj Plan Hash: 1265209789 SELECT COUNT(*) FROM T_COUNT_LHR call count cpu elapsed disk query current rows ----- -- ------ -------- ---------- ---------- ---------- ---------- ---------- Parse 1 0.00 0.00 0 0 0 0 Execute 1 0.00 0.00 0 0 0 0 Fetch 2 0.00 0.55 22 25 0 1 ----- -- ------ -------- ---------- ---------- ---------- ---------- ---------- total 4 0.01 0.56 22 25 0 1 Misses in library cache during parse: 1 Optimizer mode: ALL_ROWS Parsing user id: 90 Number of plan statistics captured: 1 Rows (1st) Rows ( avg) Rows ( max) Row Source Operation -------- -- ---------- ---------- --------------------------------------------------- 1 1 1 SORT AGGREGATE (cr =25 pr =22 pw =0 time =552894 us) 10000 10000 10000 INDEX FAST FULL SCAN PK_OBJECT_ID (cr =25 pr =22 pw =0 time =2502 us cost =7 size =0 card =10000)( object id 159543) ******************************************************************************** SQL ID: 4abkxq9x7uamj Plan Hash: 1265209789 SELECT COUNT(1) FROM T_COUNT_LHR call count cpu elapsed disk query current rows ----- -- ------ -------- ---------- ---------- ---------- ---------- ---------- Parse 1 0.00 0.01 0 0 0 0 Execute 1 0.00 0.00 0 0 0 0 Fetch 2 0.00 0.00 22 25 0 1 ----- -- ------ -------- ---------- ---------- ---------- ---------- ---------- total 4 0.00 0.01 22 25 0 1 Misses in library cache during parse: 1 Optimizer mode: ALL_ROWS Parsing user id: 90 Number of plan statistics captured: 1 Rows (1st) Rows ( avg) Rows ( max) Row Source Operation -------- -- ---------- ---------- --------------------------------------------------- 1 1 1 SORT AGGREGATE (cr =25 pr =22 pw =0 time =5934 us) 10000 10000 10000 INDEX FAST FULL SCAN PK_OBJECT_ID (cr =25 pr =22 pw =0 time =2469 us cost =7 size =0 card =10000)( object id 159543) ******************************************************************************** SQL ID: 4tm3jwzff8ub8 Plan Hash: 1265209789 SELECT COUNT( ROWID) FROM T_COUNT_LHR call count cpu elapsed disk query current rows ----- -- ------ -------- ---------- ---------- ---------- ---------- ---------- Parse 1 0.00 0.00 0 0 0 0 Execute 1 0.00 0.00 0 0 0 0 Fetch 2 0.00 0.01 22 25 0 1 ----- -- ------ -------- ---------- ---------- ---------- ---------- ---------- total 4 0.00 0.01 22 25 0 1 Misses in library cache during parse: 1 Optimizer mode: ALL_ROWS Parsing user id: 90 Number of plan statistics captured: 1 Rows (1st) Rows ( avg) Rows ( max) Row Source Operation -------- -- ---------- ---------- --------------------------------------------------- 1 1 1 SORT AGGREGATE (cr =25 pr =22 pw =0 time =11264 us) 10000 10000 10000 INDEX FAST FULL SCAN PK_OBJECT_ID (cr =25 pr =22 pw =0 time =762 us cost =7 size =120000 card =10000)( object id 159543) ******************************************************************************** |
10053事件
alter session set events '10053 trace name context forever, level 12';
alter session set events '10053 trace name context OFF';
alter system flush buffer_cache; alter system flush shared_pool; alter session set events '10053 trace name context forever, level 12'; SELECT COUNT(*) FROM T_COUNT_LHR; alter system flush buffer_cache; alter system flush shared_pool; SELECT COUNT(1) FROM T_COUNT_LHR; alter system flush buffer_cache; alter system flush shared_pool; SELECT COUNT(ROWID) FROM T_COUNT_LHR; alter session set events '10053 trace name context OFF'; select value from v$diag_info where name like '%Default%';| 1 2 3 4 5 6 7 8 9 10 11 12 13 | alter system flush buffer_cache; alter system flush shared_pool; alter session set events '10053 trace name context forever, level 12'; SELECT COUNT(*) FROM T_COUNT_LHR; alter system flush buffer_cache; alter system flush shared_pool; SELECT COUNT(1) FROM T_COUNT_LHR; alter system flush buffer_cache; alter system flush shared_pool; SELECT COUNT( ROWID) FROM T_COUNT_LHR; alter session set events '10053 trace name context OFF'; select value from v$diag_info where name like '%Default%'; |
搜索关键词“Final”、“Starting”:
Final query after transformations:******* UNPARSED QUERY IS ******* SELECT COUNT(*) "COUNT(*)" FROM "LHR"."T_COUNT_LHR" "T_COUNT_LHR" kkoqbc: optimizing query block SEL$1 (#0) : call(in-use=1216, alloc=16344), compile(in-use=58000, alloc=58544), execution(in-use=2480, alloc=4032) kkoqbc-subheap (create addr=0x7f9950a9fb58) **************** QUERY BLOCK TEXT **************** SELECT COUNT(*) FROM T_COUNT_LHR --------------------- QUERY BLOCK SIGNATURE --------------------- signature (optimizer): qb_name=SEL$1 nbfros=1 flg=0 fro(0): flg=0 objn=159542 hint_alias="T_COUNT_LHR"@"SEL$1" ----------------------------- SYSTEM STATISTICS INFORMATION ----------------------------- Using NOWORKLOAD Stats CPUSPEEDNW: 1752 millions instructions/sec (default is 100) IOTFRSPEED: 4096 bytes per millisecond (default is 4096) IOSEEKTIM: 10 milliseconds (default is 10) MBRC: NO VALUE blocks (default is 8) *************************************** BASE STATISTICAL INFORMATION *********************** Table Stats:: Table: T_COUNT_LHR Alias: T_COUNT_LHR #Rows: 10000 #Blks: 75 AvgRowLen: 44.00 ChainCnt: 0.00 Index Stats:: Index: IDX_DATA_OBJECT_ID Col#: 4 LVLS: 1 #LB: 5 #DK: 2318 LB/K: 1.00 DB/K: 1.00 CLUF: 86.00 Index: IDX_DATA_OWNER Col#: 3 LVLS: 1 #LB: 23 #DK: 5 LB/K: 4.00 DB/K: 28.00 CLUF: 141.00 Index: IDX_LDT Col#: 6 LVLS: 1 #LB: 26 #DK: 9999 LB/K: 1.00 DB/K: 1.00 CLUF: 377.00 Index: PK_OBJECT_ID Col#: 1 LVLS: 1 #LB: 20 #DK: 10000 LB/K: 1.00 DB/K: 1.00 CLUF: 76.00 Access path analysis for T_COUNT_LHR *************************************** SINGLE TABLE ACCESS PATH Single Table Cardinality Estimation for T_COUNT_LHR[T_COUNT_LHR] Table: T_COUNT_LHR Alias: T_COUNT_LHR Card: Original: 10000.000000 Rounded: 10000 Computed: 10000.00 Non Adjusted: 10000.00 Access Path: TableScan Cost: 22.10 Resp: 22.10 Degree: 0 Cost_io: 22.00 Cost_cpu: 2034108 Resp_io: 22.00 Resp_cpu: 2034108 Access Path: index (index (FFS)) Index: IDX_DATA_OWNER resc_io: 8.00 resc_cpu: 1363793 ix_sel: 0.000000 ix_sel_with_filters: 1.000000 Access Path: index (FFS) Cost: 8.06 Resp: 8.06 Degree: 1 Cost_io: 8.00 Cost_cpu: 1363793 Resp_io: 8.00 Resp_cpu: 1363793 Access Path: index (index (FFS)) Index: PK_OBJECT_ID resc_io: 7.00 resc_cpu: 1342429 ix_sel: 0.000000 ix_sel_with_filters: 1.000000 Access Path: index (FFS) Cost: 7.06 Resp: 7.06 Degree: 1 Cost_io: 7.00 Cost_cpu: 1342429 Resp_io: 7.00 Resp_cpu: 1342429 Access Path: index (FullScan) Index: IDX_DATA_OWNER resc_io: 24.00 resc_cpu: 2170915 ix_sel: 1.000000 ix_sel_with_filters: 1.000000 Cost: 24.10 Resp: 24.10 Degree: 1 Access Path: index (FullScan) Index: PK_OBJECT_ID resc_io: 21.00 resc_cpu: 2149550 ix_sel: 1.000000 ix_sel_with_filters: 1.000000 Cost: 21.10 Resp: 21.10 Degree: 1 ****** trying bitmap/domain indexes ****** Access Path: index (FullScan) Index: IDX_DATA_OWNER resc_io: 24.00 resc_cpu: 2170915 ix_sel: 1.000000 ix_sel_with_filters: 1.000000 Cost: 24.10 Resp: 24.10 Degree: 0 Access Path: index (FullScan) Index: PK_OBJECT_ID resc_io: 21.00 resc_cpu: 2149550 ix_sel: 1.000000 ix_sel_with_filters: 1.000000 Cost: 21.10 Resp: 21.10 Degree: 0 ****** finished trying bitmap/domain indexes ****** ******** Begin index join costing ******** ****** trying bitmap/domain indexes ****** Access Path: index (FullScan) Index: IDX_DATA_OWNER resc_io: 24.00 resc_cpu: 2170915 ix_sel: 1.000000 ix_sel_with_filters: 1.000000 Cost: 24.10 Resp: 24.10 Degree: 0 Access Path: index (FullScan) Index: PK_OBJECT_ID resc_io: 21.00 resc_cpu: 2149550 ix_sel: 1.000000 ix_sel_with_filters: 1.000000 Cost: 21.10 Resp: 21.10 Degree: 0 Access Path: index (FullScan) Index: PK_OBJECT_ID resc_io: 21.00 resc_cpu: 2149550 ix_sel: 1.000000 ix_sel_with_filters: 1.000000 Cost: 21.10 Resp: 21.10 Degree: 0 Bitmap nodes: Used PK_OBJECT_ID Cost = 26.377821, sel = 1.000000 ****** finished trying bitmap/domain indexes ****** ******** End index join costing ******** Best:: AccessPath: IndexFFS Index: PK_OBJECT_ID Cost: 7.06 Degree: 1 Resp: 7.06 Card: 10000.00 Bytes: 0 *************************************** 。。。。。。。。。。。。。。 Starting SQL statement dump user_id=90 user_name=LHR module=SQL*Plus action= sql_id=g9rksvy7gkdmj plan_hash_value=1265209789 problem_type=3 ----- Current SQL Statement for this session (sql_id=g9rksvy7gkdmj) ----- SELECT COUNT(*) FROM T_COUNT_LHR sql_text_length=33 sql=SELECT COUNT(*) FROM T_COUNT_LHR ----- Explain Plan Dump ----- ----- Plan Table ----- ============ Plan Table ============ ---------------------------------------------+-----------------------------------+ | Id | Operation | Name | Rows | Bytes | Cost | Time | ---------------------------------------------+-----------------------------------+ | 0 | SELECT STATEMENT | | | | 7 | | | 1 | SORT AGGREGATE | | 1 | | | | | 2 | INDEX FAST FULL SCAN | PK_OBJECT_ID| 10K | | 7 | 00:00:01 | ---------------------------------------------+-----------------------------------+ Predicate Information: ---------------------- Content of other_xml column =========================== db_version : 11.2.0.3 parse_schema : LHR plan_hash : 1265209789 plan_hash_2 : 3881728982 Outline Data: /*+ BEGIN_OUTLINE_DATA IGNORE_OPTIM_EMBEDDED_HINTS OPTIMIZER_FEATURES_ENABLE('11.2.0.3') DB_VERSION('11.2.0.3') OPT_PARAM('star_transformation_enabled' 'true') ALL_ROWS OUTLINE_LEAF(@"SEL$1") INDEX_FFS(@"SEL$1" "T_COUNT_LHR"@"SEL$1" ("T_COUNT_LHR"."OBJECT_ID")) END_OUTLINE_DATA */ 。。。。。。。。。。。。。。。。 ====================== END SQL Statement Dump ====================== Final query after transformations:******* UNPARSED QUERY IS ******* SELECT COUNT(*) "COUNT(1)" FROM "LHR"."T_COUNT_LHR" "T_COUNT_LHR" kkoqbc: optimizing query block SEL$1 (#0) : call(in-use=1240, alloc=16344), compile(in-use=58312, alloc=58544), execution(in-use=2480, alloc=4032) kkoqbc-subheap (create addr=0x7f9950a9fb58) **************** QUERY BLOCK TEXT **************** SELECT COUNT(1) FROM T_COUNT_LHR --------------------- QUERY BLOCK SIGNATURE --------------------- signature (optimizer): qb_name=SEL$1 nbfros=1 flg=0 fro(0): flg=0 objn=159542 hint_alias="T_COUNT_LHR"@"SEL$1" ----------------------------- SYSTEM STATISTICS INFORMATION ----------------------------- Using NOWORKLOAD Stats CPUSPEEDNW: 1752 millions instructions/sec (default is 100) IOTFRSPEED: 4096 bytes per millisecond (default is 4096) IOSEEKTIM: 10 milliseconds (default is 10) MBRC: NO VALUE blocks (default is 8) *************************************** BASE STATISTICAL INFORMATION *********************** Table Stats:: Table: T_COUNT_LHR Alias: T_COUNT_LHR #Rows: 10000 #Blks: 75 AvgRowLen: 44.00 ChainCnt: 0.00 Index Stats:: Index: IDX_DATA_OBJECT_ID Col#: 4 LVLS: 1 #LB: 5 #DK: 2318 LB/K: 1.00 DB/K: 1.00 CLUF: 86.00 Index: IDX_DATA_OWNER Col#: 3 LVLS: 1 #LB: 23 #DK: 5 LB/K: 4.00 DB/K: 28.00 CLUF: 141.00 Index: IDX_LDT Col#: 6 LVLS: 1 #LB: 26 #DK: 9999 LB/K: 1.00 DB/K: 1.00 CLUF: 377.00 Index: PK_OBJECT_ID Col#: 1 LVLS: 1 #LB: 20 #DK: 10000 LB/K: 1.00 DB/K: 1.00 CLUF: 76.00 Access path analysis for T_COUNT_LHR *************************************** SINGLE TABLE ACCESS PATH Single Table Cardinality Estimation for T_COUNT_LHR[T_COUNT_LHR] Table: T_COUNT_LHR Alias: T_COUNT_LHR Card: Original: 10000.000000 Rounded: 10000 Computed: 10000.00 Non Adjusted: 10000.00 Access Path: TableScan Cost: 22.10 Resp: 22.10 Degree: 0 Cost_io: 22.00 Cost_cpu: 2034108 Resp_io: 22.00 Resp_cpu: 2034108 Access Path: index (index (FFS)) Index: IDX_DATA_OWNER resc_io: 8.00 resc_cpu: 1363793 ix_sel: 0.000000 ix_sel_with_filters: 1.000000 Access Path: index (FFS) Cost: 8.06 Resp: 8.06 Degree: 1 Cost_io: 8.00 Cost_cpu: 1363793 Resp_io: 8.00 Resp_cpu: 1363793 Access Path: index (index (FFS)) Index: PK_OBJECT_ID resc_io: 7.00 resc_cpu: 1342429 ix_sel: 0.000000 ix_sel_with_filters: 1.000000 Access Path: index (FFS) Cost: 7.06 Resp: 7.06 Degree: 1 Cost_io: 7.00 Cost_cpu: 1342429 Resp_io: 7.00 Resp_cpu: 1342429 Access Path: index (FullScan) Index: IDX_DATA_OWNER resc_io: 24.00 resc_cpu: 2170915 ix_sel: 1.000000 ix_sel_with_filters: 1.000000 Cost: 24.10 Resp: 24.10 Degree: 1 Access Path: index (FullScan) Index: PK_OBJECT_ID resc_io: 21.00 resc_cpu: 2149550 ix_sel: 1.000000 ix_sel_with_filters: 1.000000 Cost: 21.10 Resp: 21.10 Degree: 1 ****** trying bitmap/domain indexes ****** Access Path: index (FullScan) Index: IDX_DATA_OWNER resc_io: 24.00 resc_cpu: 2170915 ix_sel: 1.000000 ix_sel_with_filters: 1.000000 Cost: 24.10 Resp: 24.10 Degree: 0 Access Path: index (FullScan) Index: PK_OBJECT_ID resc_io: 21.00 resc_cpu: 2149550 ix_sel: 1.000000 ix_sel_with_filters: 1.000000 Cost: 21.10 Resp: 21.10 Degree: 0 ****** finished trying bitmap/domain indexes ****** ******** Begin index join costing ******** ****** trying bitmap/domain indexes ****** Access Path: index (FullScan) Index: IDX_DATA_OWNER resc_io: 24.00 resc_cpu: 2170915 ix_sel: 1.000000 ix_sel_with_filters: 1.000000 Cost: 24.10 Resp: 24.10 Degree: 0 Access Path: index (FullScan) Index: PK_OBJECT_ID resc_io: 21.00 resc_cpu: 2149550 ix_sel: 1.000000 ix_sel_with_filters: 1.000000 Cost: 21.10 Resp: 21.10 Degree: 0 Access Path: index (FullScan) Index: PK_OBJECT_ID resc_io: 21.00 resc_cpu: 2149550 ix_sel: 1.000000 ix_sel_with_filters: 1.000000 Cost: 21.10 Resp: 21.10 Degree: 0 Bitmap nodes: Used PK_OBJECT_ID Cost = 26.377821, sel = 1.000000 ****** finished trying bitmap/domain indexes ****** ******** End index join costing ******** Best:: AccessPath: IndexFFS Index: PK_OBJECT_ID Cost: 7.06 Degree: 1 Resp: 7.06 Card: 10000.00 Bytes: 0 *************************************** 。。。。。。。。。。。。。。。。。 Starting SQL statement dump user_id=90 user_name=LHR module=SQL*Plus action= sql_id=4abkxq9x7uamj plan_hash_value=1265209789 problem_type=3 ----- Current SQL Statement for this session (sql_id=4abkxq9x7uamj) ----- SELECT COUNT(1) FROM T_COUNT_LHR sql_text_length=33 sql=SELECT COUNT(1) FROM T_COUNT_LHR ----- Explain Plan Dump ----- ----- Plan Table ----- ============ Plan Table ============ ---------------------------------------------+-----------------------------------+ | Id | Operation | Name | Rows | Bytes | Cost | Time | ---------------------------------------------+-----------------------------------+ | 0 | SELECT STATEMENT | | | | 7 | | | 1 | SORT AGGREGATE | | 1 | | | | | 2 | INDEX FAST FULL SCAN | PK_OBJECT_ID| 10K | | 7 | 00:00:01 | ---------------------------------------------+-----------------------------------+ Predicate Information: ---------------------- Content of other_xml column =========================== db_version : 11.2.0.3 parse_schema : LHR plan_hash : 1265209789 plan_hash_2 : 3881728982 Outline Data: /*+ BEGIN_OUTLINE_DATA IGNORE_OPTIM_EMBEDDED_HINTS OPTIMIZER_FEATURES_ENABLE('11.2.0.3') DB_VERSION('11.2.0.3') OPT_PARAM('star_transformation_enabled' 'true') ALL_ROWS OUTLINE_LEAF(@"SEL$1") INDEX_FFS(@"SEL$1" "T_COUNT_LHR"@"SEL$1" ("T_COUNT_LHR"."OBJECT_ID")) END_OUTLINE_DATA */ ====================== END SQL Statement Dump ====================== ****************************************** ----- Current SQL Statement for this session (sql_id=4tm3jwzff8ub8) ----- SELECT COUNT(ROWID) FROM T_COUNT_LHR ******************************************* 。。。。。。。。。 Final query after transformations:******* UNPARSED QUERY IS ******* SELECT COUNT("T_COUNT_LHR".ROWID) "COUNT(ROWID)" FROM "LHR"."T_COUNT_LHR" "T_COUNT_LHR" kkoqbc: optimizing query block SEL$1 (#0) : call(in-use=1240, alloc=16344), compile(in-use=58224, alloc=62688), execution(in-use=2480, alloc=4032) kkoqbc-subheap (create addr=0x7f9950a9fb58) **************** QUERY BLOCK TEXT **************** SELECT COUNT(ROWID) FROM T_COUNT_LHR --------------------- QUERY BLOCK SIGNATURE --------------------- signature (optimizer): qb_name=SEL$1 nbfros=1 flg=0 fro(0): flg=0 objn=159542 hint_alias="T_COUNT_LHR"@"SEL$1" ----------------------------- SYSTEM STATISTICS INFORMATION ----------------------------- Using NOWORKLOAD Stats CPUSPEEDNW: 1752 millions instructions/sec (default is 100) IOTFRSPEED: 4096 bytes per millisecond (default is 4096) IOSEEKTIM: 10 milliseconds (default is 10) MBRC: NO VALUE blocks (default is 8) *************************************** BASE STATISTICAL INFORMATION *********************** Table Stats:: Table: T_COUNT_LHR Alias: T_COUNT_LHR #Rows: 10000 #Blks: 75 AvgRowLen: 44.00 ChainCnt: 0.00 Index Stats:: Index: IDX_DATA_OBJECT_ID Col#: 4 LVLS: 1 #LB: 5 #DK: 2318 LB/K: 1.00 DB/K: 1.00 CLUF: 86.00 Index: IDX_DATA_OWNER Col#: 3 LVLS: 1 #LB: 23 #DK: 5 LB/K: 4.00 DB/K: 28.00 CLUF: 141.00 Index: IDX_LDT Col#: 6 LVLS: 1 #LB: 26 #DK: 9999 LB/K: 1.00 DB/K: 1.00 CLUF: 377.00 Index: PK_OBJECT_ID Col#: 1 LVLS: 1 #LB: 20 #DK: 10000 LB/K: 1.00 DB/K: 1.00 CLUF: 76.00 Access path analysis for T_COUNT_LHR *************************************** SINGLE TABLE ACCESS PATH Single Table Cardinality Estimation for T_COUNT_LHR[T_COUNT_LHR] Table: T_COUNT_LHR Alias: T_COUNT_LHR Card: Original: 10000.000000 Rounded: 10000 Computed: 10000.00 Non Adjusted: 10000.00 Access Path: TableScan Cost: 22.10 Resp: 22.10 Degree: 0 Cost_io: 22.00 Cost_cpu: 2034108 Resp_io: 22.00 Resp_cpu: 2034108 Access Path: index (index (FFS)) Index: IDX_DATA_OWNER resc_io: 8.00 resc_cpu: 1363793 ix_sel: 0.000000 ix_sel_with_filters: 1.000000 Access Path: index (FFS) Cost: 8.06 Resp: 8.06 Degree: 1 Cost_io: 8.00 Cost_cpu: 1363793 Resp_io: 8.00 Resp_cpu: 1363793 Access Path: index (index (FFS)) Index: PK_OBJECT_ID resc_io: 7.00 resc_cpu: 1342429 ix_sel: 0.000000 ix_sel_with_filters: 1.000000 Access Path: index (FFS) Cost: 7.06 Resp: 7.06 Degree: 1 Cost_io: 7.00 Cost_cpu: 1342429 Resp_io: 7.00 Resp_cpu: 1342429 Access Path: index (FullScan) Index: IDX_DATA_OWNER resc_io: 24.00 resc_cpu: 2170915 ix_sel: 1.000000 ix_sel_with_filters: 1.000000 Cost: 24.10 Resp: 24.10 Degree: 1 Access Path: index (FullScan) Index: PK_OBJECT_ID resc_io: 21.00 resc_cpu: 2149550 ix_sel: 1.000000 ix_sel_with_filters: 1.000000 Cost: 21.10 Resp: 21.10 Degree: 1 ****** trying bitmap/domain indexes ****** Access Path: index (FullScan) Index: IDX_DATA_OWNER resc_io: 24.00 resc_cpu: 2170915 ix_sel: 1.000000 ix_sel_with_filters: 1.000000 Cost: 24.10 Resp: 24.10 Degree: 0 Access Path: index (FullScan) Index: PK_OBJECT_ID resc_io: 21.00 resc_cpu: 2149550 ix_sel: 1.000000 ix_sel_with_filters: 1.000000 Cost: 21.10 Resp: 21.10 Degree: 0 ****** finished trying bitmap/domain indexes ****** Best:: AccessPath: IndexFFS Index: PK_OBJECT_ID Cost: 7.06 Degree: 1 Resp: 7.06 Card: 10000.00 Bytes: 0 *************************************** 。。。。。。。。。。。。。。。。。 Starting SQL statement dump user_id=90 user_name=LHR module=SQL*Plus action= sql_id=4tm3jwzff8ub8 plan_hash_value=1265209789 problem_type=3 ----- Current SQL Statement for this session (sql_id=4tm3jwzff8ub8) ----- SELECT COUNT(ROWID) FROM T_COUNT_LHR sql_text_length=37 sql=SELECT COUNT(ROWID) FROM T_COUNT_LHR ----- Explain Plan Dump ----- ----- Plan Table ----- ============ Plan Table ============ ---------------------------------------------+-----------------------------------+ | Id | Operation | Name | Rows | Bytes | Cost | Time | ---------------------------------------------+-----------------------------------+ | 0 | SELECT STATEMENT | | | | 7 | | | 1 | SORT AGGREGATE | | 1 | 12 | | | | 2 | INDEX FAST FULL SCAN | PK_OBJECT_ID| 10K | 117K | 7 | 00:00:01 | ---------------------------------------------+-----------------------------------+ Predicate Information: ---------------------- Content of other_xml column =========================== db_version : 11.2.0.3 parse_schema : LHR plan_hash : 1265209789 plan_hash_2 : 3881728982 Outline Data: /*+ BEGIN_OUTLINE_DATA IGNORE_OPTIM_EMBEDDED_HINTS OPTIMIZER_FEATURES_ENABLE('11.2.0.3') DB_VERSION('11.2.0.3') OPT_PARAM('star_transformation_enabled' 'true') ALL_ROWS OUTLINE_LEAF(@"SEL$1") INDEX_FFS(@"SEL$1" "T_COUNT_LHR"@"SEL$1" ("T_COUNT_LHR"."OBJECT_ID")) END_OUTLINE_DATA */ 。。。。。。。。。。。。 ====================== END SQL Statement Dump ======================| 1 2 3 4 5 6 7 8 9 10 11 12 13 14 15 16 17 18 19 20 21 22 23 24 25 26 27 28 29 30 31 32 33 34 35 36 37 38 39 40 41 42 43 44 45 46 47 48 49 50 51 52 53 54 55 56 57 58 59 60 61 62 63 64 65 66 67 68 69 70 71 72 73 74 75 76 77 78 79 80 81 82 83 84 85 86 87 88 89 90 91 92 93 94 95 96 97 98 99 100 101 102 103 104 105 106 107 108 109 110 111 112 113 114 115 116 117 118 119 120 121 122 123 124 125 126 127 128 129 130 131 132 133 134 135 136 137 138 139 140 141 142 143 144 145 146 147 148 149 150 151 152 153 154 155 156 157 158 159 160 161 162 163 164 165 166 167 168 169 170 171 172 173 174 175 176 177 178 179 180 181 182 183 184 185 186 187 188 189 190 191 192 193 194 195 196 197 198 199 200 201 202 203 204 205 206 207 208 209 210 211 212 213 214 215 216 217 218 219 220 221 222 223 224 225 226 227 228 229 230 231 232 233 234 235 236 237 238 239 240 241 242 243 244 245 246 247 248 249 250 251 252 253 254 255 256 257 258 259 260 261 262 263 264 265 266 267 268 269 270 271 272 273 274 275 276 277 278 279 280 281 282 283 284 285 286 287 288 289 290 291 292 293 294 295 296 297 298 299 300 301 302 303 304 305 306 307 308 309 310 311 312 313 314 315 316 317 318 319 320 321 322 323 324 325 326 327 328 329 330 331 332 333 334 335 336 337 338 339 340 341 342 343 344 345 346 347 348 349 350 351 352 353 354 355 356 357 358 359 360 361 362 363 364 365 366 367 368 369 370 371 372 373 374 375 376 377 378 379 380 381 382 383 384 385 386 387 388 389 390 391 392 393 394 395 396 397 398 399 400 401 402 403 404 405 406 407 408 409 410 411 412 413 414 415 416 417 418 419 420 421 422 423 424 425 426 427 428 429 430 431 432 433 434 435 436 437 438 439 440 441 442 443 444 445 446 447 448 449 450 451 452 453 454 455 456 457 458 459 460 461 462 463 464 465 466 467 468 469 470 471 472 473 474 475 476 | Final query after transformations:******* UNPARSED QUERY IS ******* SELECT COUNT(*) "COUNT(*)" FROM "LHR". "T_COUNT_LHR" "T_COUNT_LHR" kkoqbc: optimizing query block SEL$1 (#0) : call( in - use =1216, alloc =16344), compile( in - use =58000, alloc =58544), execution( in - use =2480, alloc =4032) kkoqbc -subheap ( create addr =0x7f9950a9fb58) **************** QUERY BLOCK TEXT **************** SELECT COUNT(*) FROM T_COUNT_LHR --------------------- QUERY BLOCK SIGNATURE --------------------- signature (optimizer): qb_name =SEL$1 nbfros =1 flg =0 fro(0): flg =0 objn =159542 hint_alias= "T_COUNT_LHR"@ "SEL$1" ----------------------------- SYSTEM STATISTICS INFORMATION ----------------------------- Using NOWORKLOAD Stats CPUSPEEDNW: 1752 millions instructions /sec ( default is 100) IOTFRSPEED: 4096 bytes per millisecond ( default is 4096) IOSEEKTIM: 10 milliseconds ( default is 10) MBRC: NO VALUE blocks ( default is 8) *************************************** BASE STATISTICAL INFORMATION *********************** Table Stats:: Table: T_COUNT_LHR Alias: T_COUNT_LHR # Rows: 10000 #Blks: 75 AvgRowLen: 44.00 ChainCnt: 0.00 Index Stats:: Index: IDX_DATA_OBJECT_ID Co l#: 4 LVLS: 1 #LB: 5 #DK: 2318 LB /K: 1.00 DB /K: 1.00 CLUF: 86.00 Index: IDX_DATA_OWNER Co l#: 3 LVLS: 1 #LB: 23 #DK: 5 LB /K: 4.00 DB /K: 28.00 CLUF: 141.00 Index: IDX_LDT Co l#: 6 LVLS: 1 #LB: 26 #DK: 9999 LB /K: 1.00 DB /K: 1.00 CLUF: 377.00 Index: PK_OBJECT_ID Co l#: 1 LVLS: 1 #LB: 20 #DK: 10000 LB /K: 1.00 DB /K: 1.00 CLUF: 76.00 Access path analysis for T_COUNT_LHR *************************************** SINGLE TABLE ACCESS PATH Single Table Cardinality Estimation for T_COUNT_LHR[T_COUNT_LHR] Table: T_COUNT_LHR Alias: T_COUNT_LHR Card: Original: 10000.000000 Rounded: 10000 Computed: 10000.00 Non Adjusted: 10000.00 Access Path: TableScan Cost: 22.10 Resp: 22.10 Degree: 0 Cost_io: 22.00 Cost_cpu: 2034108 Resp_io: 22.00 Resp_cpu: 2034108 Access Path: index ( index (FFS)) Index: IDX_DATA_OWNER resc_io: 8.00 resc_cpu: 1363793 ix_sel: 0.000000 ix_sel_with_filters: 1.000000 Access Path: index (FFS) Cost: 8.06 Resp: 8.06 Degree: 1 Cost_io: 8.00 Cost_cpu: 1363793 Resp_io: 8.00 Resp_cpu: 1363793 Access Path: index ( index (FFS)) Index: PK_OBJECT_ID resc_io: 7.00 resc_cpu: 1342429 ix_sel: 0.000000 ix_sel_with_filters: 1.000000 Access Path: index (FFS) Cost: 7.06 Resp: 7.06 Degree: 1 Cost_io: 7.00 Cost_cpu: 1342429 Resp_io: 7.00 Resp_cpu: 1342429 Access Path: index (FullScan) Index: IDX_DATA_OWNER resc_io: 24.00 resc_cpu: 2170915 ix_sel: 1.000000 ix_sel_with_filters: 1.000000 Cost: 24.10 Resp: 24.10 Degree: 1 Access Path: index (FullScan) Index: PK_OBJECT_ID resc_io: 21.00 resc_cpu: 2149550 ix_sel: 1.000000 ix_sel_with_filters: 1.000000 Cost: 21.10 Resp: 21.10 Degree: 1 ****** trying bitmap /domain indexes ****** Access Path: index (FullScan) Index: IDX_DATA_OWNER resc_io: 24.00 resc_cpu: 2170915 ix_sel: 1.000000 ix_sel_with_filters: 1.000000 Cost: 24.10 Resp: 24.10 Degree: 0 Access Path: index (FullScan) Index: PK_OBJECT_ID resc_io: 21.00 resc_cpu: 2149550 ix_sel: 1.000000 ix_sel_with_filters: 1.000000 Cost: 21.10 Resp: 21.10 Degree: 0 ****** finished trying bitmap /domain indexes ****** ******** Begin index join costing ******** ****** trying bitmap /domain indexes ****** Access Path: index (FullScan) Index: IDX_DATA_OWNER resc_io: 24.00 resc_cpu: 2170915 ix_sel: 1.000000 ix_sel_with_filters: 1.000000 Cost: 24.10 Resp: 24.10 Degree: 0 Access Path: index (FullScan) Index: PK_OBJECT_ID resc_io: 21.00 resc_cpu: 2149550 ix_sel: 1.000000 ix_sel_with_filters: 1.000000 Cost: 21.10 Resp: 21.10 Degree: 0 Access Path: index (FullScan) Index: PK_OBJECT_ID resc_io: 21.00 resc_cpu: 2149550 ix_sel: 1.000000 ix_sel_with_filters: 1.000000 Cost: 21.10 Resp: 21.10 Degree: 0 Bitmap nodes: Used PK_OBJECT_ID Cost = 26.377821, sel = 1.000000 ****** finished trying bitmap /domain indexes ****** ******** End index join costing ******** Best:: AccessPath: IndexFFS Index: PK_OBJECT_ID Cost: 7.06 Degree: 1 Resp: 7.06 Card: 10000.00 Bytes: 0 *************************************** 。。。。。。。。。。。。。。 Starting SQL statement dump user_id =90 user_name =LHR module = SQL *Plus action= sql_id =g9rksvy7gkdmj plan_hash_value =1265209789 problem_type =3 --- -- Current SQL Statement for this session (sql_id=g9rksvy7gkdmj) ----- SELECT COUNT(*) FROM T_COUNT_LHR sql_text_length =33 sql = SELECT COUNT(*) FROM T_COUNT_LHR --- -- Explain Plan Dump ----- --- -- Plan Table ----- ============ Plan Table ============ ---------------------------------------------+-----------------------------------+ | Id | Operation | Name | Rows | Bytes | Cost | Time | ---------------------------------------------+-----------------------------------+ | 0 | SELECT STATEMENT | | | | 7 | | | 1 | SORT AGGREGATE | | 1 | | | | | 2 | INDEX FAST FULL SCAN | PK_OBJECT_ID| 10K | | 7 | 00:00:01 | ---------------------------------------------+-----------------------------------+ Predicate Information: ---------------------- Content of other_xml column =========================== db_version : 11.2.0.3 parse_schema : LHR plan_hash : 1265209789 plan_hash_2 : 3881728982 Outline Data: /*+ BEGIN_OUTLINE_DATA IGNORE_OPTIM_EMBEDDED_HINTS OPTIMIZER_FEATURES_ENABLE('11.2.0.3') DB_VERSION('11.2.0.3') OPT_PARAM('star_transformation_enabled' 'true') ALL_ROWS OUTLINE_LEAF(@"SEL$1") INDEX_FFS(@"SEL$1" "T_COUNT_LHR"@"SEL$1" ("T_COUNT_LHR"."OBJECT_ID")) END_OUTLINE_DATA */ 。。。。。。。。。。。。。。。。 ====================== END SQL Statement Dump ====================== Final query after transformations:******* UNPARSED QUERY IS ******* SELECT COUNT(*) "COUNT(1)" FROM "LHR". "T_COUNT_LHR" "T_COUNT_LHR" kkoqbc: optimizing query block SEL$1 (#0) : call( in - use =1240, alloc =16344), compile( in - use =58312, alloc =58544), execution( in - use =2480, alloc =4032) kkoqbc -subheap ( create addr =0x7f9950a9fb58) **************** QUERY BLOCK TEXT **************** SELECT COUNT(1) FROM T_COUNT_LHR --------------------- QUERY BLOCK SIGNATURE --------------------- signature (optimizer): qb_name =SEL$1 nbfros =1 flg =0 fro(0): flg =0 objn =159542 hint_alias= "T_COUNT_LHR"@ "SEL$1" ----------------------------- SYSTEM STATISTICS INFORMATION ----------------------------- Using NOWORKLOAD Stats CPUSPEEDNW: 1752 millions instructions /sec ( default is 100) IOTFRSPEED: 4096 bytes per millisecond ( default is 4096) IOSEEKTIM: 10 milliseconds ( default is 10) MBRC: NO VALUE blocks ( default is 8) *************************************** BASE STATISTICAL INFORMATION *********************** Table Stats:: Table: T_COUNT_LHR Alias: T_COUNT_LHR # Rows: 10000 #Blks: 75 AvgRowLen: 44.00 ChainCnt: 0.00 Index Stats:: Index: IDX_DATA_OBJECT_ID Co l#: 4 LVLS: 1 #LB: 5 #DK: 2318 LB /K: 1.00 DB /K: 1.00 CLUF: 86.00 Index: IDX_DATA_OWNER Co l#: 3 LVLS: 1 #LB: 23 #DK: 5 LB /K: 4.00 DB /K: 28.00 CLUF: 141.00 Index: IDX_LDT Co l#: 6 LVLS: 1 #LB: 26 #DK: 9999 LB /K: 1.00 DB /K: 1.00 CLUF: 377.00 Index: PK_OBJECT_ID Co l#: 1 LVLS: 1 #LB: 20 #DK: 10000 LB /K: 1.00 DB /K: 1.00 CLUF: 76.00 Access path analysis for T_COUNT_LHR *************************************** SINGLE TABLE ACCESS PATH Single Table Cardinality Estimation for T_COUNT_LHR[T_COUNT_LHR] Table: T_COUNT_LHR Alias: T_COUNT_LHR Card: Original: 10000.000000 Rounded: 10000 Computed: 10000.00 Non Adjusted: 10000.00 Access Path: TableScan Cost: 22.10 Resp: 22.10 Degree: 0 Cost_io: 22.00 Cost_cpu: 2034108 Resp_io: 22.00 Resp_cpu: 2034108 Access Path: index ( index (FFS)) Index: IDX_DATA_OWNER resc_io: 8.00 resc_cpu: 1363793 ix_sel: 0.000000 ix_sel_with_filters: 1.000000 Access Path: index (FFS) Cost: 8.06 Resp: 8.06 Degree: 1 Cost_io: 8.00 Cost_cpu: 1363793 Resp_io: 8.00 Resp_cpu: 1363793 Access Path: index ( index (FFS)) Index: PK_OBJECT_ID resc_io: 7.00 resc_cpu: 1342429 ix_sel: 0.000000 ix_sel_with_filters: 1.000000 Access Path: index (FFS) Cost: 7.06 Resp: 7.06 Degree: 1 Cost_io: 7.00 Cost_cpu: 1342429 Resp_io: 7.00 Resp_cpu: 1342429 Access Path: index (FullScan) Index: IDX_DATA_OWNER resc_io: 24.00 resc_cpu: 2170915 ix_sel: 1.000000 ix_sel_with_filters: 1.000000 Cost: 24.10 Resp: 24.10 Degree: 1 Access Path: index (FullScan) Index: PK_OBJECT_ID resc_io: 21.00 resc_cpu: 2149550 ix_sel: 1.000000 ix_sel_with_filters: 1.000000 Cost: 21.10 Resp: 21.10 Degree: 1 ****** trying bitmap /domain indexes ****** Access Path: index (FullScan) Index: IDX_DATA_OWNER resc_io: 24.00 resc_cpu: 2170915 ix_sel: 1.000000 ix_sel_with_filters: 1.000000 Cost: 24.10 Resp: 24.10 Degree: 0 Access Path: index (FullScan) Index: PK_OBJECT_ID resc_io: 21.00 resc_cpu: 2149550 ix_sel: 1.000000 ix_sel_with_filters: 1.000000 Cost: 21.10 Resp: 21.10 Degree: 0 ****** finished trying bitmap /domain indexes ****** ******** Begin index join costing ******** ****** trying bitmap /domain indexes ****** Access Path: index (FullScan) Index: IDX_DATA_OWNER resc_io: 24.00 resc_cpu: 2170915 ix_sel: 1.000000 ix_sel_with_filters: 1.000000 Cost: 24.10 Resp: 24.10 Degree: 0 Access Path: index (FullScan) Index: PK_OBJECT_ID resc_io: 21.00 resc_cpu: 2149550 ix_sel: 1.000000 ix_sel_with_filters: 1.000000 Cost: 21.10 Resp: 21.10 Degree: 0 Access Path: index (FullScan) Index: PK_OBJECT_ID resc_io: 21.00 resc_cpu: 2149550 ix_sel: 1.000000 ix_sel_with_filters: 1.000000 Cost: 21.10 Resp: 21.10 Degree: 0 Bitmap nodes: Used PK_OBJECT_ID Cost = 26.377821, sel = 1.000000 ****** finished trying bitmap /domain indexes ****** ******** End index join costing ******** Best:: AccessPath: IndexFFS Index: PK_OBJECT_ID Cost: 7.06 Degree: 1 Resp: 7.06 Card: 10000.00 Bytes: 0 *************************************** 。。。。。。。。。。。。。。。。。 Starting SQL statement dump user_id =90 user_name =LHR module = SQL *Plus action= sql_id =4abkxq9x7uamj plan_hash_value =1265209789 problem_type =3 --- -- Current SQL Statement for this session (sql_id=4abkxq9x7uamj) ----- SELECT COUNT(1) FROM T_COUNT_LHR sql_text_length =33 sql = SELECT COUNT(1) FROM T_COUNT_LHR --- -- Explain Plan Dump ----- --- -- Plan Table ----- ============ Plan Table ============ ---------------------------------------------+-----------------------------------+ | Id | Operation | Name | Rows | Bytes | Cost | Time | ---------------------------------------------+-----------------------------------+ | 0 | SELECT STATEMENT | | | | 7 | | | 1 | SORT AGGREGATE | | 1 | | | | | 2 | INDEX FAST FULL SCAN | PK_OBJECT_ID| 10K | | 7 | 00:00:01 | ---------------------------------------------+-----------------------------------+ Predicate Information: ---------------------- Content of other_xml column =========================== db_version : 11.2.0.3 parse_schema : LHR plan_hash : 1265209789 plan_hash_2 : 3881728982 Outline Data: /*+ BEGIN_OUTLINE_DATA IGNORE_OPTIM_EMBEDDED_HINTS OPTIMIZER_FEATURES_ENABLE('11.2.0.3') DB_VERSION('11.2.0.3') OPT_PARAM('star_transformation_enabled' 'true') ALL_ROWS OUTLINE_LEAF(@"SEL$1") INDEX_FFS(@"SEL$1" "T_COUNT_LHR"@"SEL$1" ("T_COUNT_LHR"."OBJECT_ID")) END_OUTLINE_DATA */ ====================== END SQL Statement Dump ====================== ****************************************** --- -- Current SQL Statement for this session (sql_id=4tm3jwzff8ub8) ----- SELECT COUNT( ROWID) FROM T_COUNT_LHR ******************************************* 。。。。。。。。。 Final query after transformations:******* UNPARSED QUERY IS ******* SELECT COUNT( "T_COUNT_LHR". ROWID) "COUNT(ROWID)" FROM "LHR". "T_COUNT_LHR" "T_COUNT_LHR" kkoqbc: optimizing query block SEL$1 (#0) : call( in - use =1240, alloc =16344), compile( in - use =58224, alloc =62688), execution( in - use =2480, alloc =4032) kkoqbc -subheap ( create addr =0x7f9950a9fb58) **************** QUERY BLOCK TEXT **************** SELECT COUNT( ROWID) FROM T_COUNT_LHR --------------------- QUERY BLOCK SIGNATURE --------------------- signature (optimizer): qb_name =SEL$1 nbfros =1 flg =0 fro(0): flg =0 objn =159542 hint_alias= "T_COUNT_LHR"@ "SEL$1" ----------------------------- SYSTEM STATISTICS INFORMATION ----------------------------- Using NOWORKLOAD Stats CPUSPEEDNW: 1752 millions instructions /sec ( default is 100) IOTFRSPEED: 4096 bytes per millisecond ( default is 4096) IOSEEKTIM: 10 milliseconds ( default is 10) MBRC: NO VALUE blocks ( default is 8) *************************************** BASE STATISTICAL INFORMATION *********************** Table Stats:: Table: T_COUNT_LHR Alias: T_COUNT_LHR # Rows: 10000 #Blks: 75 AvgRowLen: 44.00 ChainCnt: 0.00 Index Stats:: Index: IDX_DATA_OBJECT_ID Co l#: 4 LVLS: 1 #LB: 5 #DK: 2318 LB /K: 1.00 DB /K: 1.00 CLUF: 86.00 Index: IDX_DATA_OWNER Co l#: 3 LVLS: 1 #LB: 23 #DK: 5 LB /K: 4.00 DB /K: 28.00 CLUF: 141.00 Index: IDX_LDT Co l#: 6 LVLS: 1 #LB: 26 #DK: 9999 LB /K: 1.00 DB /K: 1.00 CLUF: 377.00 Index: PK_OBJECT_ID Co l#: 1 LVLS: 1 #LB: 20 #DK: 10000 LB /K: 1.00 DB /K: 1.00 CLUF: 76.00 Access path analysis for T_COUNT_LHR *************************************** SINGLE TABLE ACCESS PATH Single Table Cardinality Estimation for T_COUNT_LHR[T_COUNT_LHR] Table: T_COUNT_LHR Alias: T_COUNT_LHR Card: Original: 10000.000000 Rounded: 10000 Computed: 10000.00 Non Adjusted: 10000.00 Access Path: TableScan Cost: 22.10 Resp: 22.10 Degree: 0 Cost_io: 22.00 Cost_cpu: 2034108 Resp_io: 22.00 Resp_cpu: 2034108 Access Path: index ( index (FFS)) Index: IDX_DATA_OWNER resc_io: 8.00 resc_cpu: 1363793 ix_sel: 0.000000 ix_sel_with_filters: 1.000000 Access Path: index (FFS) Cost: 8.06 Resp: 8.06 Degree: 1 Cost_io: 8.00 Cost_cpu: 1363793 Resp_io: 8.00 Resp_cpu: 1363793 Access Path: index ( index (FFS)) Index: PK_OBJECT_ID resc_io: 7.00 resc_cpu: 1342429 ix_sel: 0.000000 ix_sel_with_filters: 1.000000 Access Path: index (FFS) Cost: 7.06 Resp: 7.06 Degree: 1 Cost_io: 7.00 Cost_cpu: 1342429 Resp_io: 7.00 Resp_cpu: 1342429 Access Path: index (FullScan) Index: IDX_DATA_OWNER resc_io: 24.00 resc_cpu: 2170915 ix_sel: 1.000000 ix_sel_with_filters: 1.000000 Cost: 24.10 Resp: 24.10 Degree: 1 Access Path: index (FullScan) Index: PK_OBJECT_ID resc_io: 21.00 resc_cpu: 2149550 ix_sel: 1.000000 ix_sel_with_filters: 1.000000 Cost: 21.10 Resp: 21.10 Degree: 1 ****** trying bitmap /domain indexes ****** Access Path: index (FullScan) Index: IDX_DATA_OWNER resc_io: 24.00 resc_cpu: 2170915 ix_sel: 1.000000 ix_sel_with_filters: 1.000000 Cost: 24.10 Resp: 24.10 Degree: 0 Access Path: index (FullScan) Index: PK_OBJECT_ID resc_io: 21.00 resc_cpu: 2149550 ix_sel: 1.000000 ix_sel_with_filters: 1.000000 Cost: 21.10 Resp: 21.10 Degree: 0 ****** finished trying bitmap /domain indexes ****** Best:: AccessPath: IndexFFS Index: PK_OBJECT_ID Cost: 7.06 Degree: 1 Resp: 7.06 Card: 10000.00 Bytes: 0 *************************************** 。。。。。。。。。。。。。。。。。 Starting SQL statement dump user_id =90 user_name =LHR module = SQL *Plus action= sql_id =4tm3jwzff8ub8 plan_hash_value =1265209789 problem_type =3 --- -- Current SQL Statement for this session (sql_id=4tm3jwzff8ub8) ----- SELECT COUNT( ROWID) FROM T_COUNT_LHR sql_text_length =37 sql = SELECT COUNT( ROWID) FROM T_COUNT_LHR --- -- Explain Plan Dump ----- --- -- Plan Table ----- ============ Plan Table ============ ---------------------------------------------+-----------------------------------+ | Id | Operation | Name | Rows | Bytes | Cost | Time | ---------------------------------------------+-----------------------------------+ | 0 | SELECT STATEMENT | | | | 7 | | | 1 | SORT AGGREGATE | | 1 | 12 | | | | 2 | INDEX FAST FULL SCAN | PK_OBJECT_ID| 10K | 117K | 7 | 00:00:01 | ---------------------------------------------+-----------------------------------+ Predicate Information: ---------------------- Content of other_xml column =========================== db_version : 11.2.0.3 parse_schema : LHR plan_hash : 1265209789 plan_hash_2 : 3881728982 Outline Data: /*+ BEGIN_OUTLINE_DATA IGNORE_OPTIM_EMBEDDED_HINTS OPTIMIZER_FEATURES_ENABLE('11.2.0.3') DB_VERSION('11.2.0.3') OPT_PARAM('star_transformation_enabled' 'true') ALL_ROWS OUTLINE_LEAF(@"SEL$1") INDEX_FFS(@"SEL$1" "T_COUNT_LHR"@"SEL$1" ("T_COUNT_LHR"."OBJECT_ID")) END_OUTLINE_DATA */ 。。。。。。。。。。。。 ====================== END SQL Statement Dump ====================== |
COUNT(COL1)和SELECT COL1的区别
其实在2014年的时候,小麦苗发布过一篇博客(http://blog.itpub.net/26736162/viewspace-1329880/),里边对这个问题有详细的实验。今天就把这个实验搬过来吧。
drop table t purge; Create Table t nologging As select * from dba_objects d ; create index ind_objectname on t(object_name); set autotrace traceonly; select t.object_name from t where t.object_name ='T'; --走索引 select t.object_name from t where UPPER(t.object_name) ='T'; --不走索引 select t.object_name from t where UPPER(t.object_name) ='T' and t.object_name IS NOT NULL ; --走索引 (INDEX FAST FULL SCAN) select t.object_name from t where UPPER(t.object_name) ||'AAA' ='T'||'AAA' and t.object_name IS NOT NULL ; --走索引 (INDEX FAST FULL SCAN) select t.object_name,t.owner from t where UPPER(t.object_name) ||'AAA' ='T'||'AAA' and t.object_name IS NOT NULL ; --不走索引| 1 2 3 4 5 6 7 8 9 10 | drop table t purge; Create Table t nologging As select * from dba_objects d ; create index ind_objectname on t(object_name); set autotrace traceonly; select t.object_name from t where t.object_name = 'T'; --走索引 select t.object_name from t where UPPER(t.object_name) = 'T'; --不走索引 select t.object_name from t where UPPER(t.object_name) = 'T' and t.object_name IS NOT NULL ; --走索引 ( INDEX FAST FULL SCAN) select t.object_name from t where UPPER(t.object_name) || 'AAA' = 'T'|| 'AAA' and t.object_name IS NOT NULL ; --走索引 ( INDEX FAST FULL SCAN) select t.object_name,t.owner from t where UPPER(t.object_name) || 'AAA' = 'T'|| 'AAA' and t.object_name IS NOT NULL ; --不走索引 |
| 1 2 3 4 5 6 7 8 9 10 11 12 13 14 15 16 17 18 19 20 21 22 23 24 25 26 27 28 29 30 31 32 33 34 35 36 37 38 39 40 41 42 43 44 45 46 47 48 49 50 51 52 53 54 55 56 57 58 59 60 61 62 63 64 65 66 67 68 69 70 71 72 73 74 75 76 77 78 79 80 81 82 83 84 85 86 87 88 89 90 91 92 93 94 95 96 97 98 99 100 101 102 103 104 105 106 107 108 109 110 111 112 113 114 115 116 117 118 119 120 121 122 123 124 125 126 127 128 129 130 131 132 133 134 135 136 137 138 139 140 141 142 143 144 145 146 147 148 149 150 151 152 153 154 155 156 157 158 159 160 161 162 163 164 165 166 167 168 169 170 171 172 173 174 175 176 177 178 179 180 181 182 183 184 185 186 187 188 189 190 191 192 193 194 195 196 197 198 199 200 201 202 203 204 205 206 207 208 209 210 211 212 213 214 215 216 217 218 219 220 221 222 223 224 225 226 227 228 229 230 231 232 233 234 235 236 237 238 | C:\Users\xiaomaimiao > sqlplus lhr /lhr @orclasm SQL *Plus: Release 11.2.0.1.0 Production on 星期三 11月 12 10:52:29 2014 Copyright (c) 1982, 2010, Oracle. All rights reserved. 连接到: Oracle Database 11g Enterprise Edition Release 11.2.0.3.0 - 64bit Production With the Partitioning, Automatic Storage Management, OLAP, Data Mining and Real Application Testing options SQL > SQL > SQL > drop table t purge; 表已删除。 SQL > Create Table t nologging As select * from dba_objects d ; 表已创建。 SQL > create index ind_objectname on t(object_name); 索引已创建。 -- -- t表所有列均可以为空 SQL > desc t Name Null? Type --------------------------------------- -- -------- ---------------------------- OWNER VARCHAR2(30) OBJECT_NAME VARCHAR2(128) SUBOBJECT_NAME VARCHAR2(30) OBJECT_ID NUMBER DATA_OBJECT_ID NUMBER OBJECT_TYPE VARCHAR2(19) CREATED DATE LAST_DDL_TIME DATE TIMESTAMP VARCHAR2(19) STATUS VARCHAR2(7) TEMPORARY VARCHAR2(1) GENERATED VARCHAR2(1) SECONDARY VARCHAR2(1) NAMESPACE NUMBER EDITION_NAME VARCHAR2(30) SQL > SQL > set autotrace traceonly; SQL > select t.object_name from t where t.object_name = 'T'; 执行计划 ---------------------------------------------------------- Plan hash value: 4280870634 ----------------------------------------------------------------------------------- | Id | Operation | Name | Rows | Bytes | Cost (%CPU)| Time | ----------------------------------------------------------------------------------- | 0 | SELECT STATEMENT | | 1 | 66 | 3 (0)| 00:00:01 | |* 1 | INDEX RANGE SCAN| IND_OBJECTNAME | 1 | 66 | 3 (0)| 00:00:01 | ----------------------------------------------------------------------------------- Predicate Information ( identified by operation id): --------------------------------------------------- 1 - access( "T". "OBJECT_NAME"= 'T') Note ----- - dynamic sampling used for this statement ( level =2) - SQL plan baseline "SQL_PLAN_503ygb00mbj6k165e82cd" used for this statement 统计信息 ---------------------------------------------------------- 34 recursive calls 43 db block gets 127 consistent gets 398 physical reads 15476 redo size 349 bytes sent via SQL *Net to client 359 bytes received via SQL *Net from client 2 SQL *Net roundtrips to / from client 0 sorts (memory) 0 sorts (disk) 1 rows processed SQL > select t.object_name from t where UPPER(t.object_name) = 'T'; 执行计划 ---------------------------------------------------------- Plan hash value: 1601196873 -------------------------------------------------------------------------- | Id | Operation | Name | Rows | Bytes | Cost (%CPU)| Time | -------------------------------------------------------------------------- | 0 | SELECT STATEMENT | | 12 | 792 | 305 (1)| 00:00:04 | |* 1 | TABLE ACCESS FULL| T | 12 | 792 | 305 (1)| 00:00:04 | -------------------------------------------------------------------------- Predicate Information ( identified by operation id): --------------------------------------------------- 1 - filter( UPPER( "T". "OBJECT_NAME")= 'T') Note ----- - dynamic sampling used for this statement ( level =2) - SQL plan baseline "SQL_PLAN_9p76pys5gdb2b94ecae5c" used for this statement 统计信息 ---------------------------------------------------------- 29 recursive calls 43 db block gets 1209 consistent gets 1092 physical reads 15484 redo size 349 bytes sent via SQL *Net to client 359 bytes received via SQL *Net from client 2 SQL *Net roundtrips to / from client 0 sorts (memory) 0 sorts (disk) 1 rows processed SQL > select t.object_name from t where UPPER(t.object_name) = 'T' and t.object_name IS NOT NULL ; 执行计划 ---------------------------------------------------------- Plan hash value: 3379870158 --------------------------------------------------------------------------------------- | Id | Operation | Name | Rows | Bytes | Cost (%CPU)| Time | --------------------------------------------------------------------------------------- | 0 | SELECT STATEMENT | | 51 | 3366 | 110 (1)| 00:00:02 | |* 1 | INDEX FAST FULL SCAN| IND_OBJECTNAME | 51 | 3366 | 110 (1)| 00:00:02 | --------------------------------------------------------------------------------------- Predicate Information ( identified by operation id): --------------------------------------------------- 1 - filter( "T". "OBJECT_NAME" IS NOT NULL AND UPPER( "T". "OBJECT_NAME")= 'T') Note ----- - dynamic sampling used for this statement ( level =2) - SQL plan baseline "SQL_PLAN_czkarb71kthws18b0c28f" used for this statement 统计信息 ---------------------------------------------------------- 29 recursive calls 43 db block gets 505 consistent gets 384 physical reads 15612 redo size 349 bytes sent via SQL *Net to client 359 bytes received via SQL *Net from client 2 SQL *Net roundtrips to / from client 0 sorts (memory) 0 sorts (disk) 1 rows processed SQL > select t.object_name,t.owner from t where UPPER(t.object_name) || 'AAA' = 'T'|| 'AAA' and t.object_name IS NOT NULL ; 执行计划 ---------------------------------------------------------- Plan hash value: 1601196873 -------------------------------------------------------------------------- | Id | Operation | Name | Rows | Bytes | Cost (%CPU)| Time | -------------------------------------------------------------------------- | 0 | SELECT STATEMENT | | 51 | 4233 | 304 (1)| 00:00:04 | |* 1 | TABLE ACCESS FULL| T | 51 | 4233 | 304 (1)| 00:00:04 | -------------------------------------------------------------------------- Predicate Information ( identified by operation id): --------------------------------------------------- 1 - filter( "T". "OBJECT_NAME" IS NOT NULL AND UPPER( "T". "OBJECT_NAME")|| 'AAA'= 'TAAA') Note ----- - dynamic sampling used for this statement ( level =2) - SQL plan baseline "SQL_PLAN_au9a1c4hwdtb894ecae5c" used for this statement 统计信息 ---------------------------------------------------------- 30 recursive calls 44 db block gets 1210 consistent gets 1091 physical reads 15748 redo size 408 bytes sent via SQL *Net to client 359 bytes received via SQL *Net from client 2 SQL *Net roundtrips to / from client 0 sorts (memory) 0 sorts (disk) 1 rows processed SQL > select t.object_name from t where UPPER(t.object_name) || 'AAA' = 'T'|| 'AAA' and t.object_name IS NOT NULL ; 执行计划 ---------------------------------------------------------- Plan hash value: 3379870158 --------------------------------------------------------------------------------------- | Id | Operation | Name | Rows | Bytes | Cost (%CPU)| Time | --------------------------------------------------------------------------------------- | 0 | SELECT STATEMENT | | 51 | 3366 | 110 (1)| 00:00:02 | |* 1 | INDEX FAST FULL SCAN| IND_OBJECTNAME | 51 | 3366 | 110 (1)| 00:00:02 | --------------------------------------------------------------------------------------- Predicate Information ( identified by operation id): --------------------------------------------------- 1 - filter( "T". "OBJECT_NAME" IS NOT NULL AND UPPER( "T". "OBJECT_NAME")|| 'AAA'= 'TAAA') Note ----- - dynamic sampling used for this statement ( level =2) - SQL plan baseline "SQL_PLAN_1gu36rnh3s2a318b0c28f" used for this statement 统计信息 ---------------------------------------------------------- 28 recursive calls 44 db block gets 505 consistent gets 6 physical reads 15544 redo size 349 bytes sent via SQL *Net to client 359 bytes received via SQL *Net from client 2 SQL *Net roundtrips to / from client 0 sorts (memory) 0 sorts (disk) 1 rows processed SQL > |
实验结论
COUNT()函数是Oracle中的聚合函数,用于统计结果集的行数。其语法形式如下所示:

| 1 | COUNT({ * | [ DISTINCT | ALL ] expr }) [ OVER (analytic_clause) ] |
COUNT returns the number of rows returned by the query. You can use it as an aggregate or analytic function.
If you specify DISTINCT, then you can specify only the query_partition_clause of the analytic_clause. The order_by_clause and windowing_clause are not allowed.
If you specify expr, then COUNT returns the number of rows where expr is not null. You can count either all rows, or only distinct values of expr.
If you specify the asterisk (*), then this function returns all rows, including duplicates and nulls. COUNT never returns null.
我们把COUNT的使用情况分为以下3类:
- COUNT(1)、COUNT(*)、COUNT(常量)、COUNT(主键)、COUNT(ROWID)、COUNT(非空列)
- COUNT(允许为空列)
- COUNT(DISTINCT 列名)
下面分别从查询结果和效率方面做个比较:
- 结果区别
- COUNT(1)、COUNT(*)、COUNT(ROWID)、COUNT(常量)、COUNT(主键)、COUNT(非空列)这几种方式统计的行数是表中所有存在的行的总数,包括值为NULL的行和非空行。所以,这几种方式的执行结果相同。这里的常量可以为数字或字符串,例如,COUNT(2)、COUNT(333)、COUNT('x')、COUNT('xiaomaimiao')。需要注意的是:这里的COUNT(1)中的“1”并不表示表中的第一列,它其实是一个表达式,可以换成任意数字或字符或表达式。
- COUNT(允许为空列) 这种方式统计的行数不会包括字段值为NULL的行。
- COUNT(DISTINCT 列名) 得到的结果是除去值为NULL和重复数据后的结果。
- “SELECT COUNT(''),COUNT(NULL) FROM T_COUNT_LHR;”返回0行。
- 效率、索引
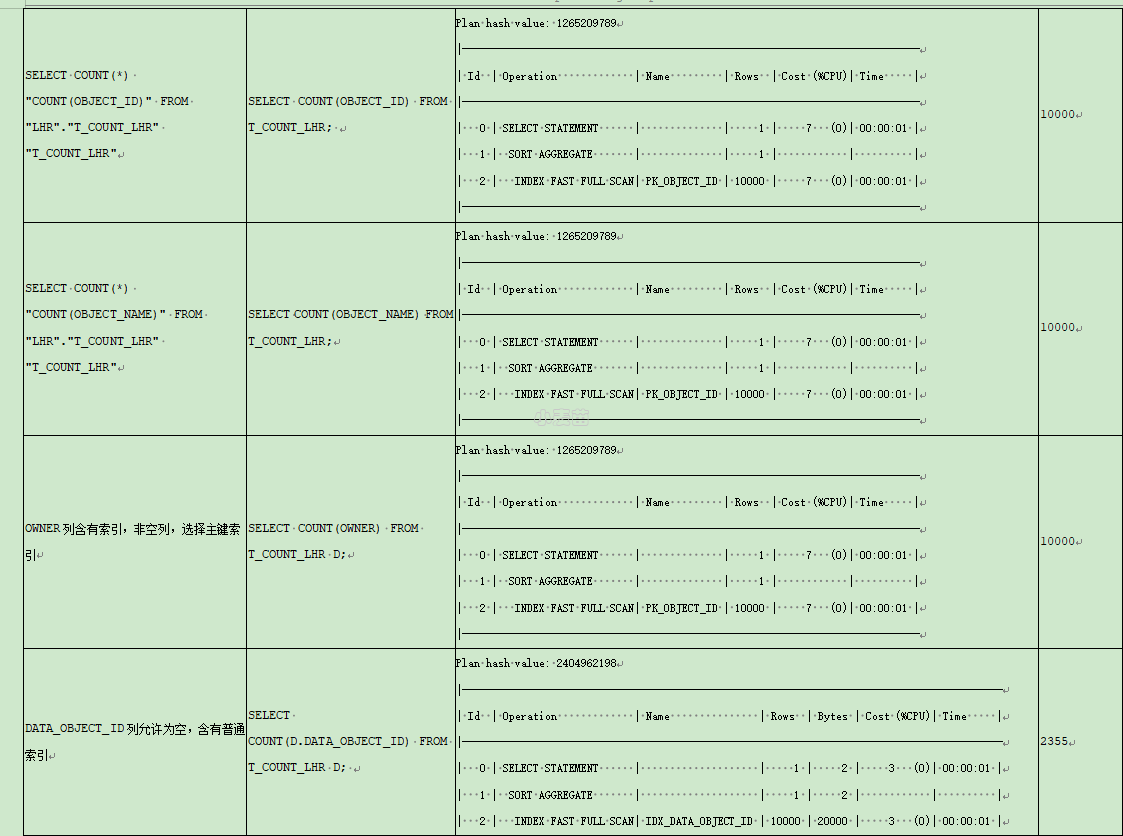
- 如果存在主键或非空列上的索引,那么COUNT(1)、COUNT(*)、COUNT(ROWID)、COUNT(常量)、COUNT(主键)、COUNT(非空列)会首先选择主键上的索引快速全扫描(INDEX FAST FULL SCAN)。若主键不存在则会选择非空列上的索引。若非空列上没有索引则肯定走全表扫描(TABLE ACCESS FULL)。其中,COUNT(ROWID)在走索引的时候比其它几种方式要慢。通过10053事件可以看到这几种方式除了COUNT(ROWID)之外,其它最终都会转换成COUNT(*)的方式来执行。
- 对于COUNT(COL1)来说,只要列字段上有索引则会选择索引快速全扫描(INDEX FAST FULL SCAN)。而对于“SELECT COL1”来说,除非列上有NOT NULL约束,否则执行计划会选择全表扫描。
- COUNT(DISTINCT 列名) 若列上有索引,且有非空约束或在WHERE子句中使用IS NOT NULL,则会选择索引快速全扫描。其余情况选择全表扫描。
关于COUNT的优化
统计记录条数,如何才能最快?xb_audit_ddl_lhr表有2303262记录。
- 全表扫描:
| 1 2 3 4 5 6 7 8 9 10 11 12 13 14 15 16 17 18 19 20 21 22 23 24 25 26 27 28 29 30 31 32 33 34 35 36 37 38 39 40 41 42 43 44 | LHR @orclasm > set line 9999 LHR @orclasm > set autot on LHR @orclasm > set timing on LHR @orclasm > set time on 12:34:01 LHR @orclasm > 12:35:20 LHR @orclasm > SELECT /*+full(t)*/ COUNT(*) FROM xb_audit_ddl_lhr t; COUNT(*) ---------- 2303262 Elapsed: 00:01:16.53 Execution Plan ---------------------------------------------------------- Plan hash value: 3725780224 ------------------------------------------------------------------------------------------------- | Id | Operation | Name | Rows | Cost (%CPU)| Time | Pstart| Pstop | ------------------------------------------------------------------------------------------------- | 0 | SELECT STATEMENT | | 1 | 26629 (1)| 00:05:20 | | | | 1 | SORT AGGREGATE | | 1 | | | | | | 2 | PARTITION RANGE ALL| | 2247K| 26629 (1)| 00:05:20 | 1 |1048575| | 3 | PARTITION HASH ALL| | 2247K| 26629 (1)| 00:05:20 | 1 | 5 | | 4 | TABLE ACCESS FULL| XB_AUDIT_DDL_LHR | 2247K| 26629 (1)| 00:05:20 | 1 |1048575| ------------------------------------------------------------------------------------------------- Statistics ---------------------------------------------------------- 1 recursive calls 57 db block gets 92274 consistent gets 92012 physical reads 0 redo size 529 bytes sent via SQL *Net to client 519 bytes received via SQL *Net from client 2 SQL *Net roundtrips to / from client 0 sorts (memory) 0 sorts (disk) 1 rows processed 12:36:47 LHR @orclasm > |
主键索引
12:38:31 LHR@orclasm > SELECT /*+index(SYS_C0011358)*/ COUNT(*) FROM xb_audit_ddl_lhr t; COUNT(*) ---------- 2303262 Elapsed: 00:00:00.24 Execution Plan ---------------------------------------------------------- Plan hash value: 2548021478 ------------------------------------------------------------------------------ | Id | Operation | Name | Rows | Cost (%CPU)| Time | ------------------------------------------------------------------------------ | 0 | SELECT STATEMENT | | 1 | 3114 (1)| 00:00:38 | | 1 | SORT AGGREGATE | | 1 | | | | 2 | INDEX FAST FULL SCAN| SYS_C0011358 | 2247K| 3114 (1)| 00:00:38 | ------------------------------------------------------------------------------ Statistics ---------------------------------------------------------- 0 recursive calls 2 db block gets 12283 consistent gets 12220 physical reads 0 redo size 529 bytes sent via SQL*Net to client 519 bytes received via SQL*Net from client 2 SQL*Net roundtrips to/from client 0 sorts (memory) 0 sorts (disk) 1 rows processed| 1 2 3 4 5 6 7 8 9 10 11 12 13 14 15 16 17 18 19 20 21 22 23 24 25 26 27 28 29 30 31 32 33 34 35 | 12:38:31 LHR @orclasm > SELECT /*+index(SYS_C0011358)*/ COUNT(*) FROM xb_audit_ddl_lhr t; COUNT(*) ---------- 2303262 Elapsed: 00:00:00.24 Execution Plan ---------------------------------------------------------- Plan hash value: 2548021478 ------------------------------------------------------------------------------ | Id | Operation | Name | Rows | Cost (%CPU)| Time | ------------------------------------------------------------------------------ | 0 | SELECT STATEMENT | | 1 | 3114 (1)| 00:00:38 | | 1 | SORT AGGREGATE | | 1 | | | | 2 | INDEX FAST FULL SCAN| SYS_C0011358 | 2247K| 3114 (1)| 00:00:38 | ------------------------------------------------------------------------------ Statistics ---------------------------------------------------------- 0 recursive calls 2 db block gets 12283 consistent gets 12220 physical reads 0 redo size 529 bytes sent via SQL *Net to client 519 bytes received via SQL *Net from client 2 SQL *Net roundtrips to / from client 0 sorts (memory) 0 sorts (disk) 1 rows processed |
位图索引
CREATE BITMAP INDEX IND_xb_operation ON xb_audit_ddl_lhr(operation) local; 12:41:44 LHR@orclasm > SELECT /*+index(IND_xb_operation)*/ COUNT(*) FROM xb_audit_ddl_lhr t; COUNT(*) ---------- 2303262 Elapsed: 00:00:00.00 Execution Plan ---------------------------------------------------------- Plan hash value: 1101410508 ------------------------------------------------------------------------------------------------------------ | Id | Operation | Name | Rows | Cost (%CPU)| Time | Pstart| Pstop | ------------------------------------------------------------------------------------------------------------ | 0 | SELECT STATEMENT | | 1 | 114 (0)| 00:00:02 | | | | 1 | SORT AGGREGATE | | 1 | | | | | | 2 | PARTITION RANGE ALL | | 2247K| 114 (0)| 00:00:02 | 1 |1048575| | 3 | PARTITION HASH ALL | | 2247K| 114 (0)| 00:00:02 | 1 | 5 | | 4 | BITMAP CONVERSION COUNT | | 2247K| 114 (0)| 00:00:02 | | | | 5 | BITMAP INDEX FAST FULL SCAN| IND_XB_OPERATION | | | | 1 |1048575| ------------------------------------------------------------------------------------------------------------ Statistics ---------------------------------------------------------- 0 recursive calls 0 db block gets 312 consistent gets 0 physical reads 0 redo size 529 bytes sent via SQL*Net to client 519 bytes received via SQL*Net from client 2 SQL*Net roundtrips to/from client 0 sorts (memory) 0 sorts (disk) 1 rows processed| 1 2 3 4 5 6 7 8 9 10 11 12 13 14 15 16 17 18 19 20 21 22 23 24 25 26 27 28 29 30 31 32 33 34 35 36 37 38 39 | CREATE BITMAP INDEX IND_xb_operation ON xb_audit_ddl_lhr(operation) local; 12:41:44 LHR @orclasm > SELECT /*+index(IND_xb_operation)*/ COUNT(*) FROM xb_audit_ddl_lhr t; COUNT(*) ---------- 2303262 Elapsed: 00:00:00.00 Execution Plan ---------------------------------------------------------- Plan hash value: 1101410508 ------------------------------------------------------------------------------------------------------------ | Id | Operation | Name | Rows | Cost (%CPU)| Time | Pstart| Pstop | ------------------------------------------------------------------------------------------------------------ | 0 | SELECT STATEMENT | | 1 | 114 (0)| 00:00:02 | | | | 1 | SORT AGGREGATE | | 1 | | | | | | 2 | PARTITION RANGE ALL | | 2247K| 114 (0)| 00:00:02 | 1 |1048575| | 3 | PARTITION HASH ALL | | 2247K| 114 (0)| 00:00:02 | 1 | 5 | | 4 | BITMAP CONVERSION COUNT | | 2247K| 114 (0)| 00:00:02 | | | | 5 | BITMAP INDEX FAST FULL SCAN| IND_XB_OPERATION | | | | 1 |1048575| ------------------------------------------------------------------------------------------------------------ Statistics ---------------------------------------------------------- 0 recursive calls 0 db block gets 312 consistent gets 0 physical reads 0 redo size 529 bytes sent via SQL *Net to client 519 bytes received via SQL *Net from client 2 SQL *Net roundtrips to / from client 0 sorts (memory) 0 sorts (disk) 1 rows processed |
在数据量超大的表上,还可以采用位图索引并行的方式。优化无止境,根据场景选择最适合的才是最好的。
参考文章
How the Oracle CBO Chooses a Path for the SELECT COUNT(*) Command (文档 ID 124717.1)
https://asktom.oracle.com/pls/asktom/f?p=100:11:0::::P11_QUESTION_ID:1156159920245
You Asked
What is the difference between count(1) and count(*) in a sql query eg. select count(1) from emp; and select count(*) from emp;| 1 2 3 4 5 6 7 | What is the difference between count(1) and count(*) in a sql query eg. select count(1) from emp; and select count(*) from emp; |
and we said...
nothing, they are the same, incur the same amount of work -- do the same thing, take the same amount of resources.
You can see this via:
ops$tkyte@ORA817.US.ORACLE.COM> alter session set sql_trace=true; Session altered. ops$tkyte@ORA817.US.ORACLE.COM> select count(*) from all_objects; COUNT(*) ---------- 27044 ops$tkyte@ORA817.US.ORACLE.COM> select count(1) from all_objects 2 / COUNT(1) ---------- 27044 and the tkprof will show: select count(*) from all_objects call count cpu elapsed disk query current rows ------- ------ -------- ---------- ---------- ---------- ---------- ---------- Parse 1 0.02 0.02 0 0 0 0 Execute 1 0.00 0.00 0 0 0 0 Fetch 2 5.56 5.56 0 234998 4 1 ------- ------ -------- ---------- ---------- ---------- ---------- ---------- total 4 5.58 5.58 0 234998 4 1 select count(1) from all_objects call count cpu elapsed disk query current rows ------- ------ -------- ---------- ---------- ---------- ---------- ---------- Parse 1 0.02 0.02 0 0 0 0 Execute 1 0.00 0.00 0 0 0 0 Fetch 2 5.46 5.47 0 234998 4 1 ------- ------ -------- ---------- ---------- ---------- ---------- ---------- total 4 5.48 5.49 0 234998 4 1| 1 2 3 4 5 6 7 8 9 10 11 12 13 14 15 16 17 18 19 20 21 22 23 24 25 26 27 28 29 30 31 32 33 34 35 36 37 38 39 40 41 42 43 44 | ops$tkyte @ORA817.US.ORACLE.COM > alter session set sql_trace = true; Session altered. ops$tkyte @ORA817.US.ORACLE.COM > select count(*) from all_objects; COUNT(*) -------- -- 27044 ops$tkyte @ORA817.US.ORACLE.COM > select count(1) from all_objects 2 / COUNT(1) -------- -- 27044 and the tkprof will show: select count(*) from all_objects call count cpu elapsed disk query current rows ----- -- ------ -------- ---------- ---------- ---------- ---------- ---------- Parse 1 0.02 0.02 0 0 0 0 Execute 1 0.00 0.00 0 0 0 0 Fetch 2 5.56 5.56 0 234998 4 1 ----- -- ------ -------- ---------- ---------- ---------- ---------- ---------- total 4 5.58 5.58 0 234998 4 1 select count(1) from all_objects call count cpu elapsed disk query current rows ----- -- ------ -------- ---------- ---------- ---------- ---------- ---------- Parse 1 0.02 0.02 0 0 0 0 Execute 1 0.00 0.00 0 0 0 0 Fetch 2 5.46 5.47 0 234998 4 1 ----- -- ------ -------- ---------- ---------- ---------- ---------- ---------- total 4 5.48 5.49 0 234998 4 1 |
Same number of blocks read/written/processed, same cpu times (basically) same elapsed times (basically).
they are identical.
Anyone who thinks different (and I know you are out there) will have to post a test case like the above or some scientific proof otherwise to be taken seriously....
相关文章
- Oracle文本数据(csv、txt)导出方法总结
- 数据泵导入报错UDI-03113、UDI-03114和ORA-03113、ORA-03114、ORA-04036参数pga_aggregate_limit太小
- impdp数据泵导入使用table_exists_action=SKIP存在的问题以及如何接着导入数据而不用重新导入
- [INS-32104] Specified Oracle Home user is not the owner of the specified Oracle Base
- 常见问题:在 Windows 平台的 Oracle 12.1 数据库版本上的 Oracle Home 用户 (Doc ID 2101982.1、Doc ID 1529702.1)
- 启动Oracle数据库报错ORA-48173、ORA-48187、OSD-00002、O/S-Error: (OS 5) Access is denied
- 在Oracle中,什么是Quote(q) Q语法?
- 在Oracle中行转列函数PRINT_TABLE的用法
- Oracle 数据泵(expdp和impdp)排除某个表
- 数据泵impdp导入卡住,等待事件wait for unread message on broadcast channel
- Oracle RAC中remote_listener和local_listener的作用是什么?
- Oracle rac不能监听public ip
- Oracle的内存结构以及ORA-04030和ORA-04031错误
- Oracle rac 修改SCAN IP信息
- 在Oracle中,“ORA-01017: invalid username/password; logon denied”的常见原因有哪些?
- Oracle查询归档日志的产生情况(每天增量大小)
- Oracle 11.2.0.4 数据泵expdp导出含CLOB字段(basicfile)的表超级慢的问题
- Oracle数据泵(expdp和impdp)导出导入报错stopped due to fatal error
- Oracle LOB介绍
- 什么是Oracle的SQLT工具和SQLHC工具
目录 返回
首页